Pima vs West Indian 9th Grade
COMPARE
Pima
West Indian
9th Grade
9th Grade Comparison
Pima
West Indians
93.9%
9TH GRADE
0.4/ 100
METRIC RATING
260th/ 347
METRIC RANK
93.7%
9TH GRADE
0.2/ 100
METRIC RATING
276th/ 347
METRIC RANK
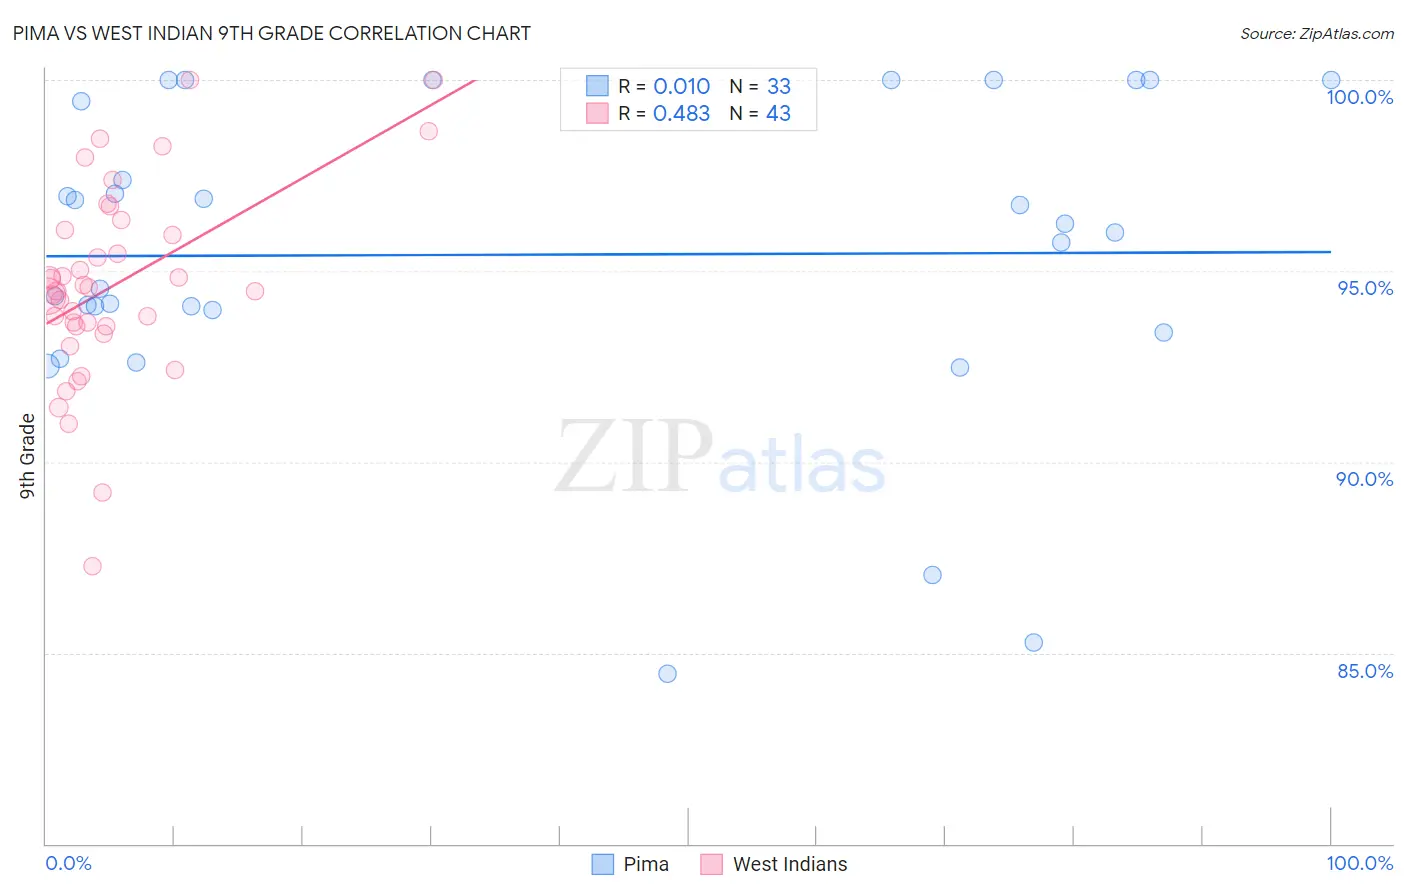
Pima vs West Indian 9th Grade Correlation Chart
The statistical analysis conducted on geographies consisting of 61,552,136 people shows no correlation between the proportion of Pima and percentage of population with at least 9th grade education in the United States with a correlation coefficient (R) of 0.010 and weighted average of 93.9%. Similarly, the statistical analysis conducted on geographies consisting of 254,059,006 people shows a moderate positive correlation between the proportion of West Indians and percentage of population with at least 9th grade education in the United States with a correlation coefficient (R) of 0.483 and weighted average of 93.7%, a difference of 0.20%.
9th Grade Correlation Summary
| Measurement | Pima | West Indian |
| Minimum | 84.5% | 87.3% |
| Maximum | 100.0% | 100.0% |
| Range | 15.5% | 12.7% |
| Mean | 95.4% | 94.6% |
| Median | 96.0% | 94.5% |
| Interquartile 25% (IQ1) | 93.7% | 93.5% |
| Interquartile 75% (IQ3) | 99.7% | 96.1% |
| Interquartile Range (IQR) | 6.0% | 2.5% |
| Standard Deviation (Sample) | 4.1% | 2.6% |
| Standard Deviation (Population) | 4.0% | 2.6% |
Demographics Similar to Pima and West Indians by 9th Grade
In terms of 9th grade, the demographic groups most similar to Pima are Immigrants from Thailand (93.9%, a difference of 0.010%), Ghanaian (93.9%, a difference of 0.010%), South American (93.9%, a difference of 0.010%), Immigrants from Jamaica (93.9%, a difference of 0.020%), and Immigrants from Uzbekistan (93.9%, a difference of 0.030%). Similarly, the demographic groups most similar to West Indians are Immigrants from Philippines (93.7%, a difference of 0.010%), Immigrants from Eritrea (93.7%, a difference of 0.010%), Immigrants from Colombia (93.8%, a difference of 0.020%), Immigrants from South America (93.8%, a difference of 0.030%), and Peruvian (93.8%, a difference of 0.030%).
| Demographics | Rating | Rank | 9th Grade |
| Immigrants | Thailand | 0.5 /100 | #258 | Tragic 93.9% |
| Ghanaians | 0.5 /100 | #259 | Tragic 93.9% |
| Pima | 0.4 /100 | #260 | Tragic 93.9% |
| South Americans | 0.4 /100 | #261 | Tragic 93.9% |
| Immigrants | Jamaica | 0.4 /100 | #262 | Tragic 93.9% |
| Immigrants | Uzbekistan | 0.4 /100 | #263 | Tragic 93.9% |
| Immigrants | Congo | 0.4 /100 | #264 | Tragic 93.9% |
| Natives/Alaskans | 0.4 /100 | #265 | Tragic 93.9% |
| Navajo | 0.3 /100 | #266 | Tragic 93.9% |
| Armenians | 0.3 /100 | #267 | Tragic 93.9% |
| Immigrants | Bolivia | 0.3 /100 | #268 | Tragic 93.9% |
| Immigrants | Uruguay | 0.2 /100 | #269 | Tragic 93.8% |
| Yuman | 0.2 /100 | #270 | Tragic 93.8% |
| Immigrants | Ghana | 0.2 /100 | #271 | Tragic 93.8% |
| Immigrants | Western Africa | 0.2 /100 | #272 | Tragic 93.8% |
| Immigrants | South America | 0.2 /100 | #273 | Tragic 93.8% |
| Peruvians | 0.2 /100 | #274 | Tragic 93.8% |
| Immigrants | Colombia | 0.2 /100 | #275 | Tragic 93.8% |
| West Indians | 0.2 /100 | #276 | Tragic 93.7% |
| Immigrants | Philippines | 0.1 /100 | #277 | Tragic 93.7% |
| Immigrants | Eritrea | 0.1 /100 | #278 | Tragic 93.7% |