Ghanaian vs Immigrants from Zaire Median Female Earnings
COMPARE
Ghanaian
Immigrants from Zaire
Median Female Earnings
Median Female Earnings Comparison
Ghanaians
Immigrants from Zaire
$40,429
MEDIAN FEMALE EARNINGS
82.1/ 100
METRIC RATING
146th/ 347
METRIC RANK
$36,017
MEDIAN FEMALE EARNINGS
0.0/ 100
METRIC RATING
288th/ 347
METRIC RANK
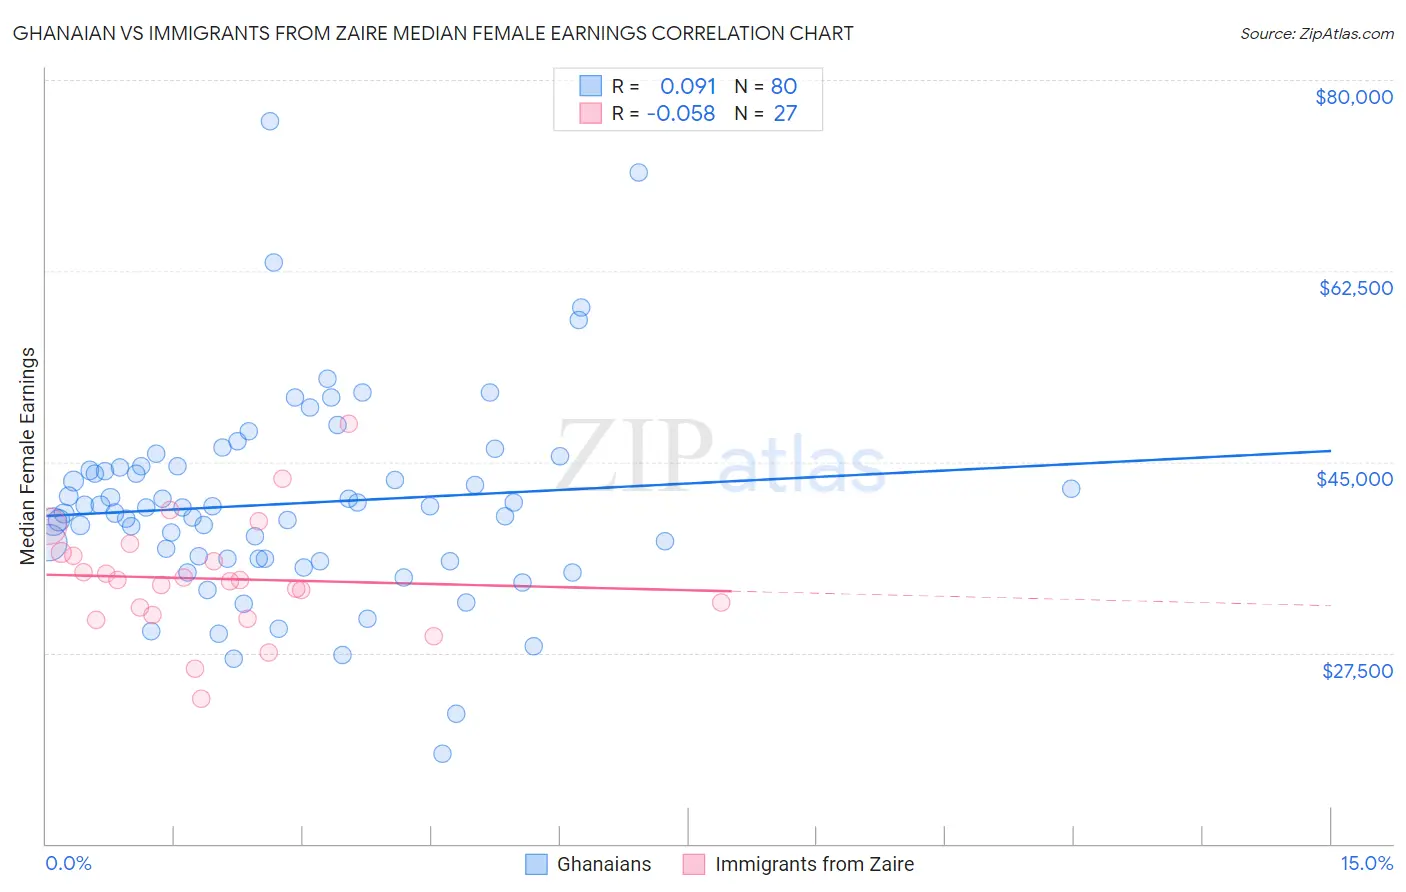
Ghanaian vs Immigrants from Zaire Median Female Earnings Correlation Chart
The statistical analysis conducted on geographies consisting of 190,707,731 people shows a slight positive correlation between the proportion of Ghanaians and median female earnings in the United States with a correlation coefficient (R) of 0.091 and weighted average of $40,429. Similarly, the statistical analysis conducted on geographies consisting of 107,241,232 people shows a slight negative correlation between the proportion of Immigrants from Zaire and median female earnings in the United States with a correlation coefficient (R) of -0.058 and weighted average of $36,017, a difference of 12.2%.
Median Female Earnings Correlation Summary
| Measurement | Ghanaian | Immigrants from Zaire |
| Minimum | $18,266 | $23,286 |
| Maximum | $76,246 | $48,487 |
| Range | $57,980 | $25,201 |
| Mean | $41,171 | $34,296 |
| Median | $40,828 | $34,189 |
| Interquartile 25% (IQ1) | $36,123 | $30,969 |
| Interquartile 75% (IQ3) | $44,535 | $36,705 |
| Interquartile Range (IQR) | $8,413 | $5,736 |
| Standard Deviation (Sample) | $9,292 | $5,243 |
| Standard Deviation (Population) | $9,234 | $5,145 |
Similar Demographics by Median Female Earnings
Demographics Similar to Ghanaians by Median Female Earnings
In terms of median female earnings, the demographic groups most similar to Ghanaians are Brazilian ($40,483, a difference of 0.13%), Vietnamese ($40,377, a difference of 0.13%), Northern European ($40,491, a difference of 0.15%), Immigrants from North Macedonia ($40,488, a difference of 0.15%), and Polish ($40,371, a difference of 0.15%).
| Demographics | Rating | Rank | Median Female Earnings |
| Immigrants | South Eastern Asia | 85.7 /100 | #139 | Excellent $40,558 |
| Serbians | 85.2 /100 | #140 | Excellent $40,539 |
| Immigrants | Syria | 84.1 /100 | #141 | Excellent $40,499 |
| Sri Lankans | 84.0 /100 | #142 | Excellent $40,496 |
| Northern Europeans | 83.9 /100 | #143 | Excellent $40,491 |
| Immigrants | North Macedonia | 83.8 /100 | #144 | Excellent $40,488 |
| Brazilians | 83.6 /100 | #145 | Excellent $40,483 |
| Ghanaians | 82.1 /100 | #146 | Excellent $40,429 |
| Vietnamese | 80.4 /100 | #147 | Excellent $40,377 |
| Poles | 80.2 /100 | #148 | Excellent $40,371 |
| Immigrants | Cameroon | 79.7 /100 | #149 | Good $40,354 |
| Immigrants | Chile | 79.6 /100 | #150 | Good $40,353 |
| Immigrants | Armenia | 79.2 /100 | #151 | Good $40,340 |
| West Indians | 78.4 /100 | #152 | Good $40,317 |
| British West Indians | 77.7 /100 | #153 | Good $40,299 |
Demographics Similar to Immigrants from Zaire by Median Female Earnings
In terms of median female earnings, the demographic groups most similar to Immigrants from Zaire are Immigrants from Nicaragua ($36,023, a difference of 0.020%), Osage ($36,034, a difference of 0.050%), Paiute ($36,056, a difference of 0.11%), Bangladeshi ($35,960, a difference of 0.16%), and Central American Indian ($35,930, a difference of 0.24%).
| Demographics | Rating | Rank | Median Female Earnings |
| Spanish Americans | 0.1 /100 | #281 | Tragic $36,391 |
| Haitians | 0.1 /100 | #282 | Tragic $36,374 |
| Immigrants | Haiti | 0.1 /100 | #283 | Tragic $36,203 |
| Indonesians | 0.1 /100 | #284 | Tragic $36,140 |
| Paiute | 0.1 /100 | #285 | Tragic $36,056 |
| Osage | 0.0 /100 | #286 | Tragic $36,034 |
| Immigrants | Nicaragua | 0.0 /100 | #287 | Tragic $36,023 |
| Immigrants | Zaire | 0.0 /100 | #288 | Tragic $36,017 |
| Bangladeshis | 0.0 /100 | #289 | Tragic $35,960 |
| Central American Indians | 0.0 /100 | #290 | Tragic $35,930 |
| Blackfeet | 0.0 /100 | #291 | Tragic $35,864 |
| Americans | 0.0 /100 | #292 | Tragic $35,777 |
| Guatemalans | 0.0 /100 | #293 | Tragic $35,695 |
| Cheyenne | 0.0 /100 | #294 | Tragic $35,673 |
| Comanche | 0.0 /100 | #295 | Tragic $35,661 |