Immigrants from Uzbekistan vs Immigrants from Zaire Median Female Earnings
COMPARE
Immigrants from Uzbekistan
Immigrants from Zaire
Median Female Earnings
Median Female Earnings Comparison
Immigrants from Uzbekistan
Immigrants from Zaire
$43,363
MEDIAN FEMALE EARNINGS
100.0/ 100
METRIC RATING
50th/ 347
METRIC RANK
$36,017
MEDIAN FEMALE EARNINGS
0.0/ 100
METRIC RATING
288th/ 347
METRIC RANK
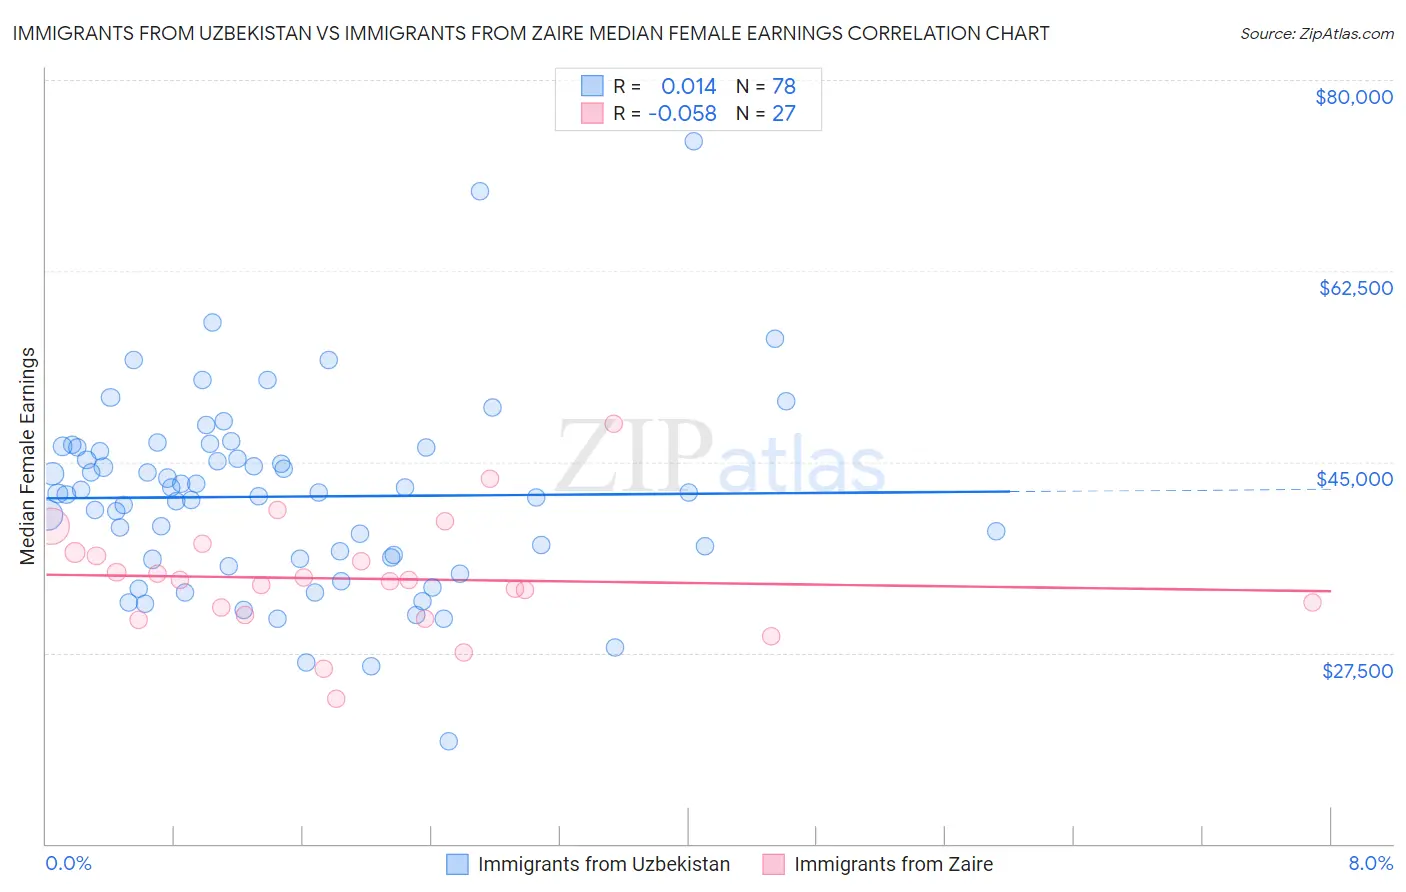
Immigrants from Uzbekistan vs Immigrants from Zaire Median Female Earnings Correlation Chart
The statistical analysis conducted on geographies consisting of 118,750,050 people shows no correlation between the proportion of Immigrants from Uzbekistan and median female earnings in the United States with a correlation coefficient (R) of 0.014 and weighted average of $43,363. Similarly, the statistical analysis conducted on geographies consisting of 107,241,232 people shows a slight negative correlation between the proportion of Immigrants from Zaire and median female earnings in the United States with a correlation coefficient (R) of -0.058 and weighted average of $36,017, a difference of 20.4%.
Median Female Earnings Correlation Summary
| Measurement | Immigrants from Uzbekistan | Immigrants from Zaire |
| Minimum | $19,444 | $23,286 |
| Maximum | $74,375 | $48,487 |
| Range | $54,931 | $25,201 |
| Mean | $41,817 | $34,296 |
| Median | $42,141 | $34,189 |
| Interquartile 25% (IQ1) | $36,088 | $30,969 |
| Interquartile 75% (IQ3) | $46,297 | $36,705 |
| Interquartile Range (IQR) | $10,209 | $5,736 |
| Standard Deviation (Sample) | $8,848 | $5,243 |
| Standard Deviation (Population) | $8,791 | $5,145 |
Similar Demographics by Median Female Earnings
Demographics Similar to Immigrants from Uzbekistan by Median Female Earnings
In terms of median female earnings, the demographic groups most similar to Immigrants from Uzbekistan are Maltese ($43,357, a difference of 0.010%), Immigrants from Serbia ($43,385, a difference of 0.050%), Immigrants from Indonesia ($43,412, a difference of 0.11%), Immigrants from Lithuania ($43,317, a difference of 0.11%), and Immigrants from Eastern Europe ($43,309, a difference of 0.12%).
| Demographics | Rating | Rank | Median Female Earnings |
| Bulgarians | 100.0 /100 | #43 | Exceptional $43,638 |
| Immigrants | Czechoslovakia | 100.0 /100 | #44 | Exceptional $43,571 |
| Immigrants | Europe | 100.0 /100 | #45 | Exceptional $43,523 |
| Immigrants | Bolivia | 100.0 /100 | #46 | Exceptional $43,467 |
| Bolivians | 100.0 /100 | #47 | Exceptional $43,445 |
| Immigrants | Indonesia | 100.0 /100 | #48 | Exceptional $43,412 |
| Immigrants | Serbia | 100.0 /100 | #49 | Exceptional $43,385 |
| Immigrants | Uzbekistan | 100.0 /100 | #50 | Exceptional $43,363 |
| Maltese | 100.0 /100 | #51 | Exceptional $43,357 |
| Immigrants | Lithuania | 99.9 /100 | #52 | Exceptional $43,317 |
| Immigrants | Eastern Europe | 99.9 /100 | #53 | Exceptional $43,309 |
| Australians | 99.9 /100 | #54 | Exceptional $43,308 |
| Egyptians | 99.9 /100 | #55 | Exceptional $43,305 |
| Immigrants | Croatia | 99.9 /100 | #56 | Exceptional $43,258 |
| Ethiopians | 99.9 /100 | #57 | Exceptional $43,243 |
Demographics Similar to Immigrants from Zaire by Median Female Earnings
In terms of median female earnings, the demographic groups most similar to Immigrants from Zaire are Immigrants from Nicaragua ($36,023, a difference of 0.020%), Osage ($36,034, a difference of 0.050%), Paiute ($36,056, a difference of 0.11%), Bangladeshi ($35,960, a difference of 0.16%), and Central American Indian ($35,930, a difference of 0.24%).
| Demographics | Rating | Rank | Median Female Earnings |
| Spanish Americans | 0.1 /100 | #281 | Tragic $36,391 |
| Haitians | 0.1 /100 | #282 | Tragic $36,374 |
| Immigrants | Haiti | 0.1 /100 | #283 | Tragic $36,203 |
| Indonesians | 0.1 /100 | #284 | Tragic $36,140 |
| Paiute | 0.1 /100 | #285 | Tragic $36,056 |
| Osage | 0.0 /100 | #286 | Tragic $36,034 |
| Immigrants | Nicaragua | 0.0 /100 | #287 | Tragic $36,023 |
| Immigrants | Zaire | 0.0 /100 | #288 | Tragic $36,017 |
| Bangladeshis | 0.0 /100 | #289 | Tragic $35,960 |
| Central American Indians | 0.0 /100 | #290 | Tragic $35,930 |
| Blackfeet | 0.0 /100 | #291 | Tragic $35,864 |
| Americans | 0.0 /100 | #292 | Tragic $35,777 |
| Guatemalans | 0.0 /100 | #293 | Tragic $35,695 |
| Cheyenne | 0.0 /100 | #294 | Tragic $35,673 |
| Comanche | 0.0 /100 | #295 | Tragic $35,661 |