Pima vs Immigrants from Zaire Doctorate Degree
COMPARE
Pima
Immigrants from Zaire
Doctorate Degree
Doctorate Degree Comparison
Pima
Immigrants from Zaire
1.3%
DOCTORATE DEGREE
0.0/ 100
METRIC RATING
325th/ 347
METRIC RANK
2.0%
DOCTORATE DEGREE
91.1/ 100
METRIC RATING
128th/ 347
METRIC RANK
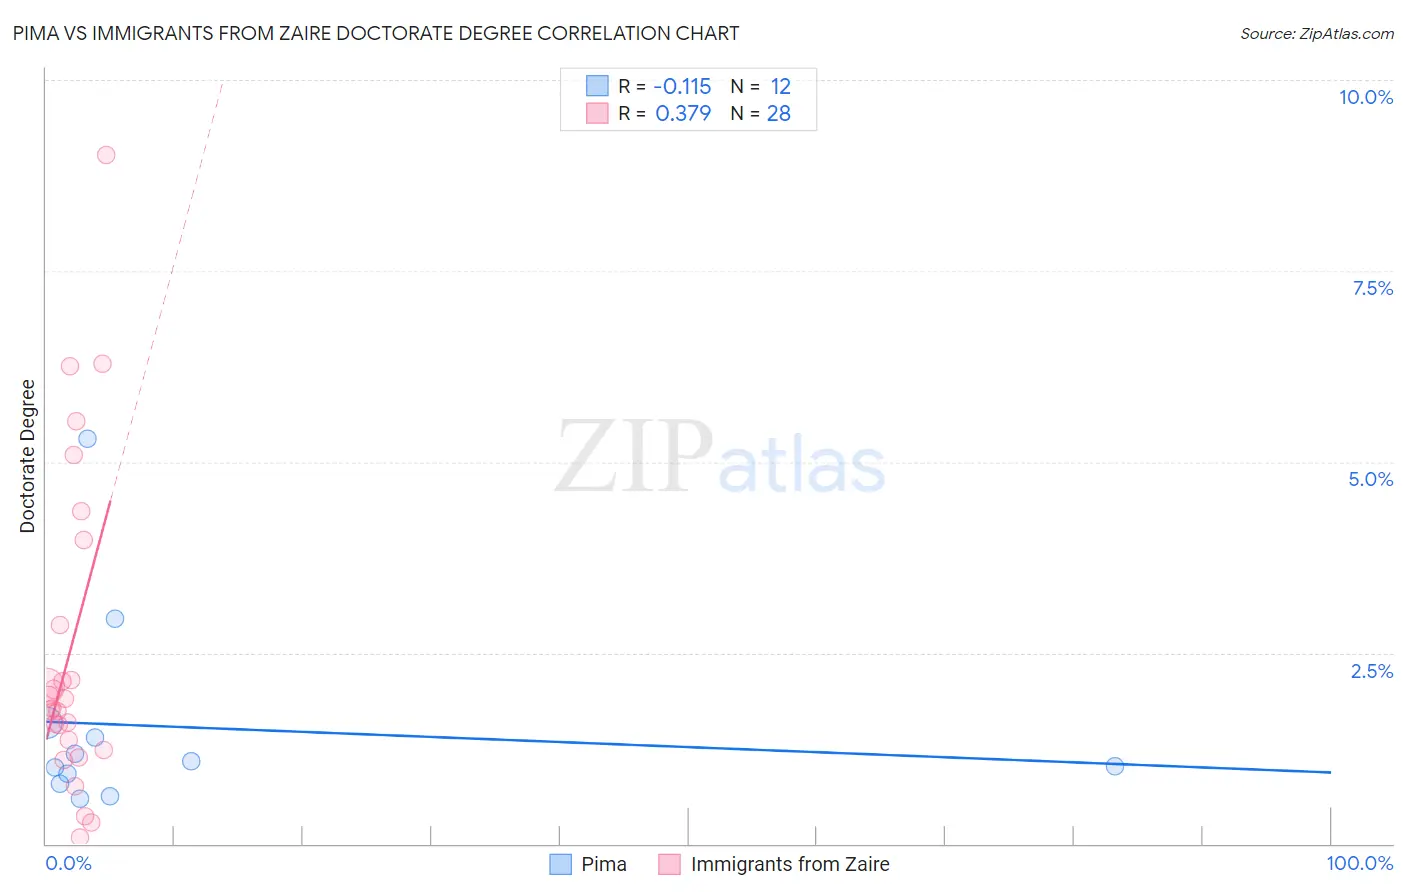
Pima vs Immigrants from Zaire Doctorate Degree Correlation Chart
The statistical analysis conducted on geographies consisting of 61,222,520 people shows a poor negative correlation between the proportion of Pima and percentage of population with at least doctorate degree education in the United States with a correlation coefficient (R) of -0.115 and weighted average of 1.3%. Similarly, the statistical analysis conducted on geographies consisting of 107,152,130 people shows a mild positive correlation between the proportion of Immigrants from Zaire and percentage of population with at least doctorate degree education in the United States with a correlation coefficient (R) of 0.379 and weighted average of 2.0%, a difference of 51.3%.
Doctorate Degree Correlation Summary
| Measurement | Pima | Immigrants from Zaire |
| Minimum | 0.59% | 0.076% |
| Maximum | 5.3% | 9.0% |
| Range | 4.7% | 8.9% |
| Mean | 1.5% | 2.6% |
| Median | 1.0% | 1.8% |
| Interquartile 25% (IQ1) | 0.85% | 1.3% |
| Interquartile 75% (IQ3) | 1.5% | 3.4% |
| Interquartile Range (IQR) | 0.64% | 2.1% |
| Standard Deviation (Sample) | 1.3% | 2.1% |
| Standard Deviation (Population) | 1.3% | 2.1% |
Similar Demographics by Doctorate Degree
Demographics Similar to Pima by Doctorate Degree
In terms of doctorate degree, the demographic groups most similar to Pima are Immigrants from Cabo Verde (1.3%, a difference of 0.020%), Hispanic or Latino (1.3%, a difference of 0.31%), Native/Alaskan (1.3%, a difference of 0.39%), Immigrants from Belize (1.3%, a difference of 0.72%), and Inupiat (1.3%, a difference of 0.89%).
| Demographics | Rating | Rank | Doctorate Degree |
| Creek | 0.1 /100 | #318 | Tragic 1.3% |
| Immigrants | Guyana | 0.1 /100 | #319 | Tragic 1.3% |
| Immigrants | St. Vincent and the Grenadines | 0.1 /100 | #320 | Tragic 1.3% |
| Dutch West Indians | 0.1 /100 | #321 | Tragic 1.3% |
| Seminole | 0.1 /100 | #322 | Tragic 1.3% |
| Immigrants | Belize | 0.1 /100 | #323 | Tragic 1.3% |
| Natives/Alaskans | 0.0 /100 | #324 | Tragic 1.3% |
| Pima | 0.0 /100 | #325 | Tragic 1.3% |
| Immigrants | Cabo Verde | 0.0 /100 | #326 | Tragic 1.3% |
| Hispanics or Latinos | 0.0 /100 | #327 | Tragic 1.3% |
| Inupiat | 0.0 /100 | #328 | Tragic 1.3% |
| Haitians | 0.0 /100 | #329 | Tragic 1.3% |
| Yup'ik | 0.0 /100 | #330 | Tragic 1.3% |
| Immigrants | Latin America | 0.0 /100 | #331 | Tragic 1.3% |
| Yakama | 0.0 /100 | #332 | Tragic 1.3% |
Demographics Similar to Immigrants from Zaire by Doctorate Degree
In terms of doctorate degree, the demographic groups most similar to Immigrants from Zaire are Canadian (2.0%, a difference of 0.22%), Immigrants from Ukraine (2.0%, a difference of 0.22%), Immigrants from Sierra Leone (2.0%, a difference of 0.36%), Palestinian (2.0%, a difference of 0.42%), and Jordanian (2.0%, a difference of 0.46%).
| Demographics | Rating | Rank | Doctorate Degree |
| Immigrants | Jordan | 94.8 /100 | #121 | Exceptional 2.0% |
| Immigrants | Southern Europe | 94.7 /100 | #122 | Exceptional 2.0% |
| Croatians | 94.0 /100 | #123 | Exceptional 2.0% |
| Ute | 93.2 /100 | #124 | Exceptional 2.0% |
| Moroccans | 93.0 /100 | #125 | Exceptional 2.0% |
| Jordanians | 92.1 /100 | #126 | Exceptional 2.0% |
| Palestinians | 92.0 /100 | #127 | Exceptional 2.0% |
| Immigrants | Zaire | 91.1 /100 | #128 | Exceptional 2.0% |
| Canadians | 90.6 /100 | #129 | Exceptional 2.0% |
| Immigrants | Ukraine | 90.5 /100 | #130 | Exceptional 2.0% |
| Immigrants | Sierra Leone | 90.2 /100 | #131 | Exceptional 2.0% |
| Scottish | 89.4 /100 | #132 | Excellent 2.0% |
| Immigrants | Uzbekistan | 89.3 /100 | #133 | Excellent 2.0% |
| Immigrants | Cameroon | 88.9 /100 | #134 | Excellent 2.0% |
| Serbians | 88.7 /100 | #135 | Excellent 2.0% |