Apache vs Immigrants from Zaire Median Female Earnings
COMPARE
Apache
Immigrants from Zaire
Median Female Earnings
Median Female Earnings Comparison
Apache
Immigrants from Zaire
$34,895
MEDIAN FEMALE EARNINGS
0.0/ 100
METRIC RATING
314th/ 347
METRIC RANK
$36,017
MEDIAN FEMALE EARNINGS
0.0/ 100
METRIC RATING
288th/ 347
METRIC RANK
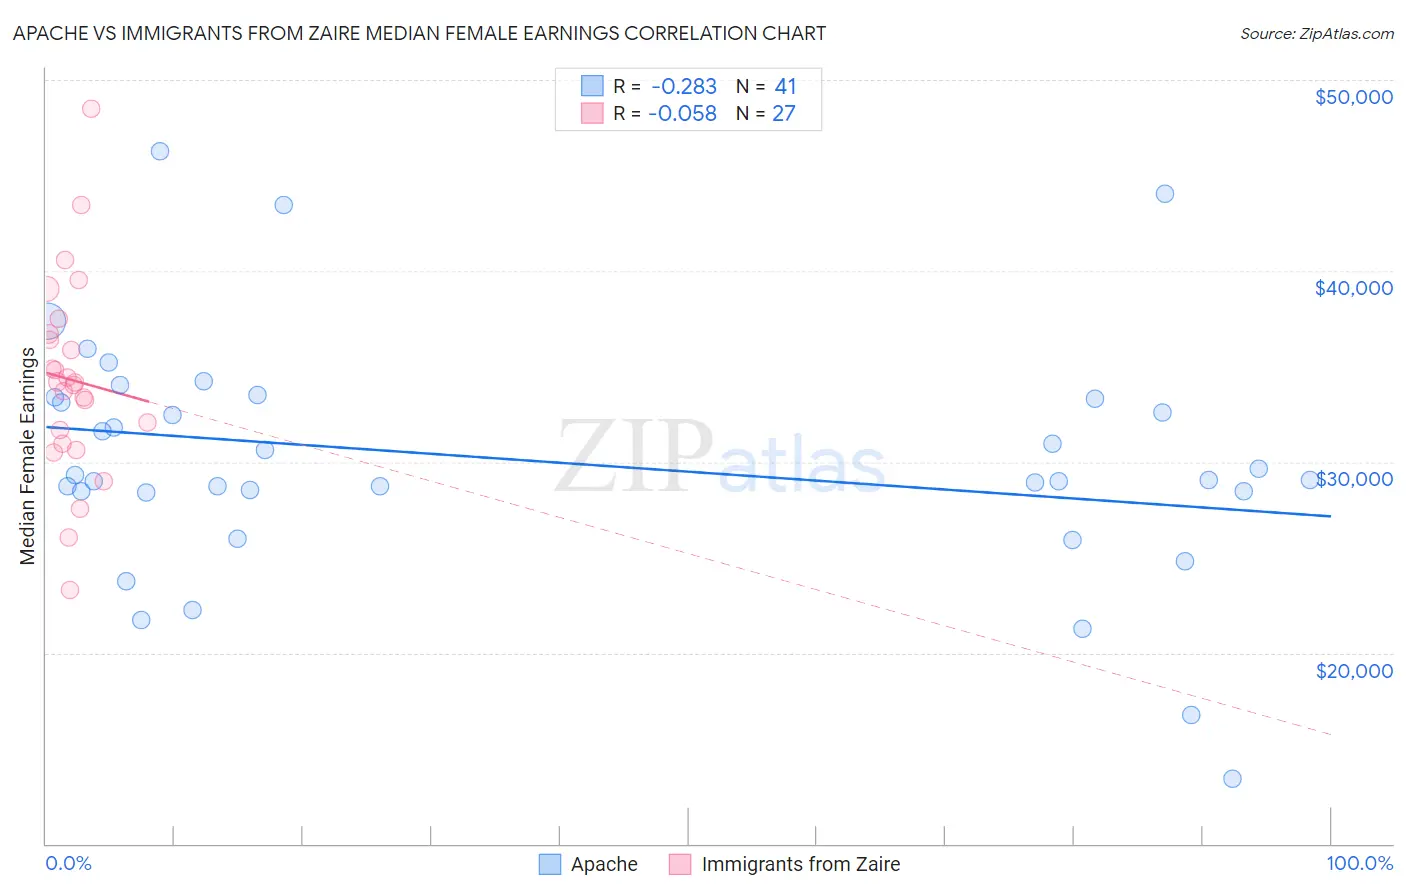
Apache vs Immigrants from Zaire Median Female Earnings Correlation Chart
The statistical analysis conducted on geographies consisting of 230,997,872 people shows a weak negative correlation between the proportion of Apache and median female earnings in the United States with a correlation coefficient (R) of -0.283 and weighted average of $34,895. Similarly, the statistical analysis conducted on geographies consisting of 107,241,232 people shows a slight negative correlation between the proportion of Immigrants from Zaire and median female earnings in the United States with a correlation coefficient (R) of -0.058 and weighted average of $36,017, a difference of 3.2%.
Median Female Earnings Correlation Summary
| Measurement | Apache | Immigrants from Zaire |
| Minimum | $13,381 | $23,286 |
| Maximum | $46,250 | $48,487 |
| Range | $32,869 | $25,201 |
| Mean | $30,090 | $34,296 |
| Median | $29,044 | $34,189 |
| Interquartile 25% (IQ1) | $28,433 | $30,969 |
| Interquartile 75% (IQ3) | $33,369 | $36,705 |
| Interquartile Range (IQR) | $4,936 | $5,736 |
| Standard Deviation (Sample) | $6,387 | $5,243 |
| Standard Deviation (Population) | $6,309 | $5,145 |
Similar Demographics by Median Female Earnings
Demographics Similar to Apache by Median Female Earnings
In terms of median female earnings, the demographic groups most similar to Apache are Cuban ($34,942, a difference of 0.13%), Yaqui ($34,943, a difference of 0.14%), Ute ($34,960, a difference of 0.19%), Pennsylvania German ($34,802, a difference of 0.27%), and Chippewa ($35,003, a difference of 0.31%).
| Demographics | Rating | Rank | Median Female Earnings |
| Sioux | 0.0 /100 | #307 | Tragic $35,063 |
| Immigrants | Bahamas | 0.0 /100 | #308 | Tragic $35,027 |
| Hondurans | 0.0 /100 | #309 | Tragic $35,013 |
| Chippewa | 0.0 /100 | #310 | Tragic $35,003 |
| Ute | 0.0 /100 | #311 | Tragic $34,960 |
| Yaqui | 0.0 /100 | #312 | Tragic $34,943 |
| Cubans | 0.0 /100 | #313 | Tragic $34,942 |
| Apache | 0.0 /100 | #314 | Tragic $34,895 |
| Pennsylvania Germans | 0.0 /100 | #315 | Tragic $34,802 |
| Cherokee | 0.0 /100 | #316 | Tragic $34,742 |
| Potawatomi | 0.0 /100 | #317 | Tragic $34,739 |
| Immigrants | Yemen | 0.0 /100 | #318 | Tragic $34,693 |
| Shoshone | 0.0 /100 | #319 | Tragic $34,677 |
| Immigrants | Honduras | 0.0 /100 | #320 | Tragic $34,647 |
| Hispanics or Latinos | 0.0 /100 | #321 | Tragic $34,421 |
Demographics Similar to Immigrants from Zaire by Median Female Earnings
In terms of median female earnings, the demographic groups most similar to Immigrants from Zaire are Immigrants from Nicaragua ($36,023, a difference of 0.020%), Osage ($36,034, a difference of 0.050%), Paiute ($36,056, a difference of 0.11%), Bangladeshi ($35,960, a difference of 0.16%), and Central American Indian ($35,930, a difference of 0.24%).
| Demographics | Rating | Rank | Median Female Earnings |
| Spanish Americans | 0.1 /100 | #281 | Tragic $36,391 |
| Haitians | 0.1 /100 | #282 | Tragic $36,374 |
| Immigrants | Haiti | 0.1 /100 | #283 | Tragic $36,203 |
| Indonesians | 0.1 /100 | #284 | Tragic $36,140 |
| Paiute | 0.1 /100 | #285 | Tragic $36,056 |
| Osage | 0.0 /100 | #286 | Tragic $36,034 |
| Immigrants | Nicaragua | 0.0 /100 | #287 | Tragic $36,023 |
| Immigrants | Zaire | 0.0 /100 | #288 | Tragic $36,017 |
| Bangladeshis | 0.0 /100 | #289 | Tragic $35,960 |
| Central American Indians | 0.0 /100 | #290 | Tragic $35,930 |
| Blackfeet | 0.0 /100 | #291 | Tragic $35,864 |
| Americans | 0.0 /100 | #292 | Tragic $35,777 |
| Guatemalans | 0.0 /100 | #293 | Tragic $35,695 |
| Cheyenne | 0.0 /100 | #294 | Tragic $35,673 |
| Comanche | 0.0 /100 | #295 | Tragic $35,661 |