Pima vs Immigrants from Sudan In Labor Force | Age 20-64
COMPARE
Pima
Immigrants from Sudan
In Labor Force | Age 20-64
In Labor Force | Age 20-64 Comparison
Pima
Immigrants from Sudan
69.0%
IN LABOR FORCE | AGE 20-64
0.0/ 100
METRIC RATING
347th/ 347
METRIC RANK
80.4%
IN LABOR FORCE | AGE 20-64
99.4/ 100
METRIC RATING
50th/ 347
METRIC RANK
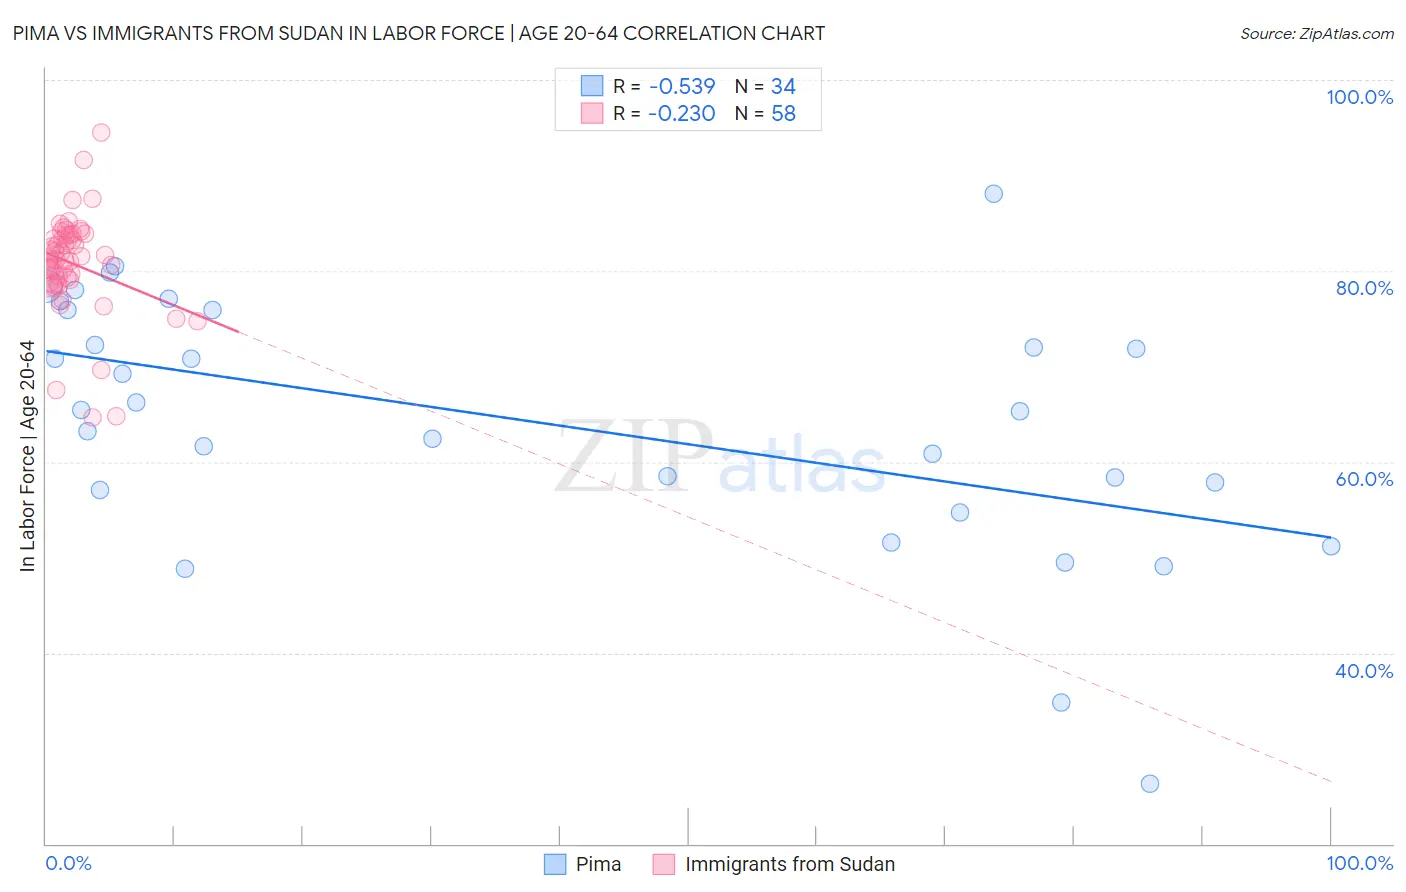
Pima vs Immigrants from Sudan In Labor Force | Age 20-64 Correlation Chart
The statistical analysis conducted on geographies consisting of 61,542,645 people shows a substantial negative correlation between the proportion of Pima and labor force participation rate among population between the ages 20 and 64 in the United States with a correlation coefficient (R) of -0.539 and weighted average of 69.0%. Similarly, the statistical analysis conducted on geographies consisting of 118,972,362 people shows a weak negative correlation between the proportion of Immigrants from Sudan and labor force participation rate among population between the ages 20 and 64 in the United States with a correlation coefficient (R) of -0.230 and weighted average of 80.4%, a difference of 16.4%.
In Labor Force | Age 20-64 Correlation Summary
| Measurement | Pima | Immigrants from Sudan |
| Minimum | 26.3% | 64.7% |
| Maximum | 88.1% | 94.5% |
| Range | 61.8% | 29.8% |
| Mean | 64.1% | 80.8% |
| Median | 65.3% | 81.3% |
| Interquartile 25% (IQ1) | 57.1% | 79.1% |
| Interquartile 75% (IQ3) | 75.9% | 83.7% |
| Interquartile Range (IQR) | 18.8% | 4.6% |
| Standard Deviation (Sample) | 13.4% | 5.2% |
| Standard Deviation (Population) | 13.2% | 5.2% |
Similar Demographics by In Labor Force | Age 20-64
Demographics Similar to Pima by In Labor Force | Age 20-64
In terms of in labor force | age 20-64, the demographic groups most similar to Pima are Navajo (69.2%, a difference of 0.16%), Tohono O'odham (70.4%, a difference of 2.0%), Lumbee (70.6%, a difference of 2.3%), Hopi (71.7%, a difference of 3.9%), and Yuman (71.7%, a difference of 3.9%).
| Demographics | Rating | Rank | In Labor Force | Age 20-64 |
| Natives/Alaskans | 0.0 /100 | #333 | Tragic 73.9% |
| Apache | 0.0 /100 | #334 | Tragic 73.7% |
| Ute | 0.0 /100 | #335 | Tragic 73.7% |
| Crow | 0.0 /100 | #336 | Tragic 73.3% |
| Yup'ik | 0.0 /100 | #337 | Tragic 73.2% |
| Puerto Ricans | 0.0 /100 | #338 | Tragic 73.1% |
| Houma | 0.0 /100 | #339 | Tragic 72.7% |
| Pueblo | 0.0 /100 | #340 | Tragic 72.6% |
| Immigrants | Yemen | 0.0 /100 | #341 | Tragic 72.3% |
| Yuman | 0.0 /100 | #342 | Tragic 71.7% |
| Hopi | 0.0 /100 | #343 | Tragic 71.7% |
| Lumbee | 0.0 /100 | #344 | Tragic 70.6% |
| Tohono O'odham | 0.0 /100 | #345 | Tragic 70.4% |
| Navajo | 0.0 /100 | #346 | Tragic 69.2% |
| Pima | 0.0 /100 | #347 | Tragic 69.0% |
Demographics Similar to Immigrants from Sudan by In Labor Force | Age 20-64
In terms of in labor force | age 20-64, the demographic groups most similar to Immigrants from Sudan are Immigrants from Greece (80.4%, a difference of 0.020%), Immigrants from Sri Lanka (80.4%, a difference of 0.030%), Turkish (80.3%, a difference of 0.040%), Immigrants from Hong Kong (80.4%, a difference of 0.050%), and Immigrants from Peru (80.3%, a difference of 0.060%).
| Demographics | Rating | Rank | In Labor Force | Age 20-64 |
| Czechs | 99.7 /100 | #43 | Exceptional 80.5% |
| Immigrants | Middle Africa | 99.7 /100 | #44 | Exceptional 80.5% |
| Slovenes | 99.7 /100 | #45 | Exceptional 80.5% |
| Immigrants | Pakistan | 99.6 /100 | #46 | Exceptional 80.5% |
| Immigrants | Africa | 99.6 /100 | #47 | Exceptional 80.4% |
| Immigrants | Hong Kong | 99.5 /100 | #48 | Exceptional 80.4% |
| Immigrants | Greece | 99.4 /100 | #49 | Exceptional 80.4% |
| Immigrants | Sudan | 99.4 /100 | #50 | Exceptional 80.4% |
| Immigrants | Sri Lanka | 99.3 /100 | #51 | Exceptional 80.4% |
| Turks | 99.2 /100 | #52 | Exceptional 80.3% |
| Immigrants | Peru | 99.2 /100 | #53 | Exceptional 80.3% |
| Peruvians | 99.1 /100 | #54 | Exceptional 80.3% |
| Immigrants | Cabo Verde | 99.0 /100 | #55 | Exceptional 80.3% |
| Immigrants | Northern Africa | 99.0 /100 | #56 | Exceptional 80.3% |
| Afghans | 98.9 /100 | #57 | Exceptional 80.3% |