Puget Sound Salish vs British Median Female Earnings
COMPARE
Puget Sound Salish
British
Median Female Earnings
Median Female Earnings Comparison
Puget Sound Salish
British
$39,376
MEDIAN FEMALE EARNINGS
33.9/ 100
METRIC RATING
190th/ 347
METRIC RANK
$39,772
MEDIAN FEMALE EARNINGS
53.8/ 100
METRIC RATING
172nd/ 347
METRIC RANK
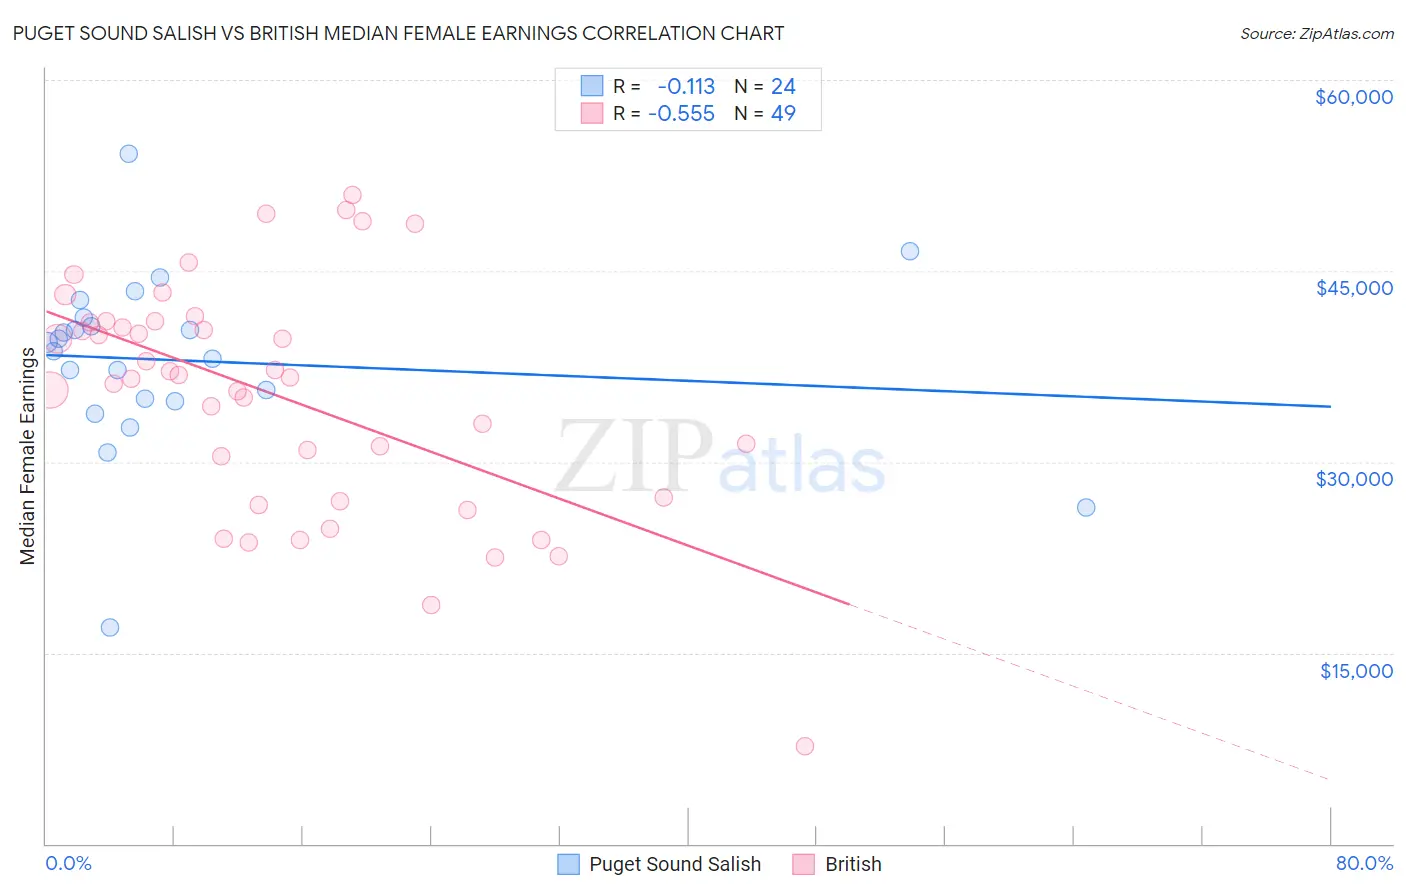
Puget Sound Salish vs British Median Female Earnings Correlation Chart
The statistical analysis conducted on geographies consisting of 46,146,789 people shows a poor negative correlation between the proportion of Puget Sound Salish and median female earnings in the United States with a correlation coefficient (R) of -0.113 and weighted average of $39,376. Similarly, the statistical analysis conducted on geographies consisting of 530,644,409 people shows a substantial negative correlation between the proportion of British and median female earnings in the United States with a correlation coefficient (R) of -0.555 and weighted average of $39,772, a difference of 1.0%.
Median Female Earnings Correlation Summary
| Measurement | Puget Sound Salish | British |
| Minimum | $17,028 | $7,631 |
| Maximum | $54,167 | $50,972 |
| Range | $37,139 | $43,341 |
| Mean | $37,933 | $35,190 |
| Median | $39,067 | $36,667 |
| Interquartile 25% (IQ1) | $34,884 | $27,044 |
| Interquartile 75% (IQ3) | $40,976 | $41,037 |
| Interquartile Range (IQR) | $6,092 | $13,994 |
| Standard Deviation (Sample) | $7,122 | $9,173 |
| Standard Deviation (Population) | $6,972 | $9,079 |
Demographics Similar to Puget Sound Salish and British by Median Female Earnings
In terms of median female earnings, the demographic groups most similar to Puget Sound Salish are Senegalese ($39,384, a difference of 0.020%), Immigrants from Western Africa ($39,351, a difference of 0.060%), Swedish ($39,421, a difference of 0.11%), Bermudan ($39,418, a difference of 0.11%), and Immigrants from West Indies ($39,441, a difference of 0.16%). Similarly, the demographic groups most similar to British are Immigrants from Portugal ($39,788, a difference of 0.040%), Canadian ($39,724, a difference of 0.12%), South American ($39,698, a difference of 0.19%), Immigrants from South America ($39,643, a difference of 0.32%), and Nigerian ($39,641, a difference of 0.33%).
| Demographics | Rating | Rank | Median Female Earnings |
| Immigrants | Portugal | 54.7 /100 | #171 | Average $39,788 |
| British | 53.8 /100 | #172 | Average $39,772 |
| Canadians | 51.4 /100 | #173 | Average $39,724 |
| South Americans | 50.0 /100 | #174 | Average $39,698 |
| Immigrants | South America | 47.2 /100 | #175 | Average $39,643 |
| Nigerians | 47.0 /100 | #176 | Average $39,641 |
| Costa Ricans | 46.1 /100 | #177 | Average $39,622 |
| Slavs | 45.6 /100 | #178 | Average $39,613 |
| Immigrants | Germany | 45.1 /100 | #179 | Average $39,603 |
| Immigrants | Kenya | 41.6 /100 | #180 | Average $39,535 |
| Tsimshian | 41.4 /100 | #181 | Average $39,530 |
| Tlingit-Haida | 40.5 /100 | #182 | Average $39,513 |
| Hungarians | 40.3 /100 | #183 | Average $39,510 |
| Europeans | 37.7 /100 | #184 | Fair $39,457 |
| Immigrants | West Indies | 36.9 /100 | #185 | Fair $39,441 |
| Colombians | 36.9 /100 | #186 | Fair $39,439 |
| Swedes | 36.0 /100 | #187 | Fair $39,421 |
| Bermudans | 35.9 /100 | #188 | Fair $39,418 |
| Senegalese | 34.2 /100 | #189 | Fair $39,384 |
| Puget Sound Salish | 33.9 /100 | #190 | Fair $39,376 |
| Immigrants | Western Africa | 32.7 /100 | #191 | Fair $39,351 |