Yakama vs British Median Female Earnings
COMPARE
Yakama
British
Median Female Earnings
Median Female Earnings Comparison
Yakama
British
$33,354
MEDIAN FEMALE EARNINGS
0.0/ 100
METRIC RATING
337th/ 347
METRIC RANK
$39,772
MEDIAN FEMALE EARNINGS
53.8/ 100
METRIC RATING
172nd/ 347
METRIC RANK
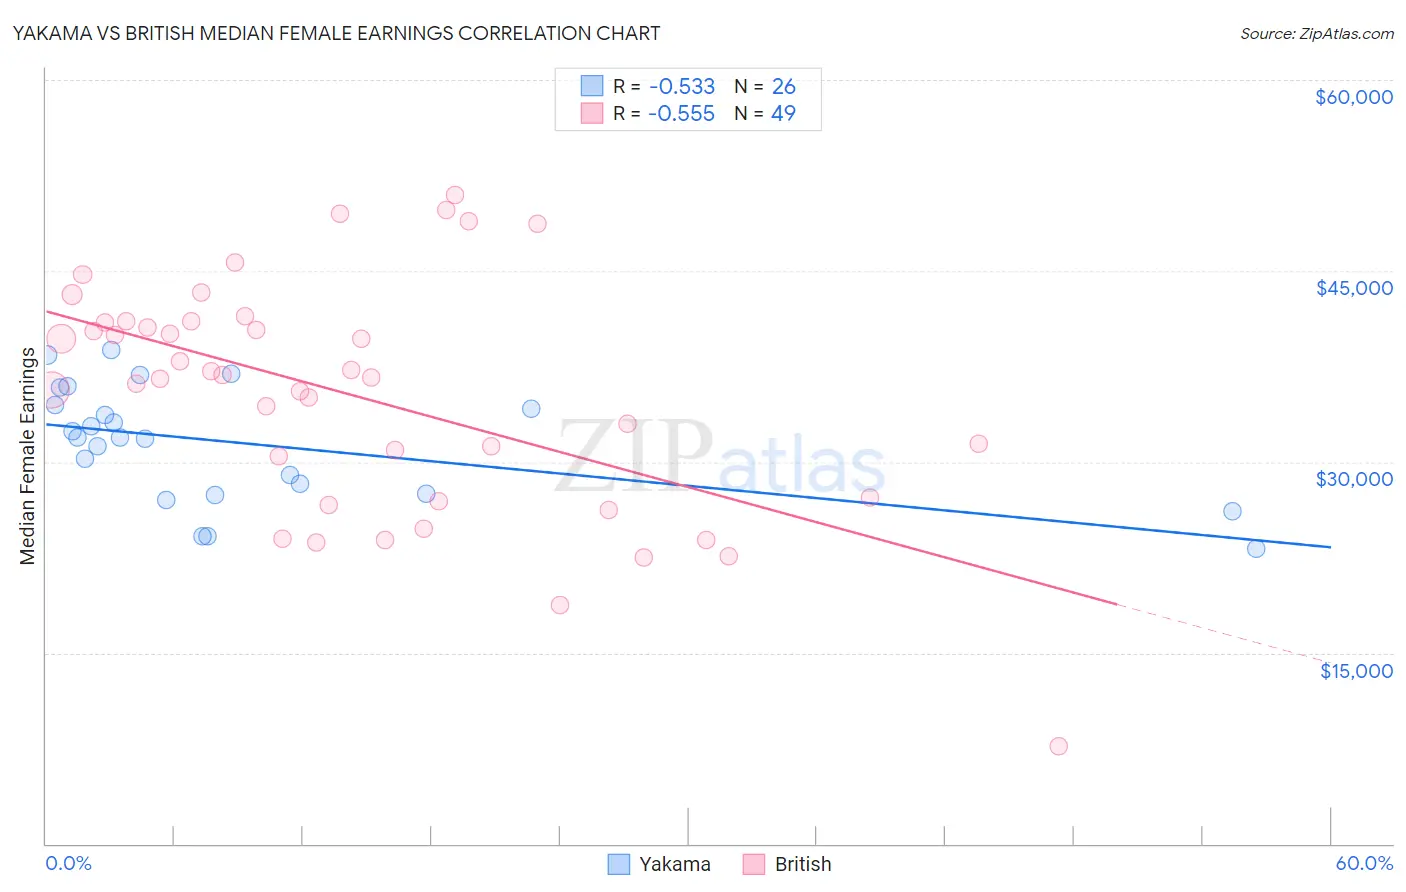
Yakama vs British Median Female Earnings Correlation Chart
The statistical analysis conducted on geographies consisting of 19,910,730 people shows a substantial negative correlation between the proportion of Yakama and median female earnings in the United States with a correlation coefficient (R) of -0.533 and weighted average of $33,354. Similarly, the statistical analysis conducted on geographies consisting of 530,644,409 people shows a substantial negative correlation between the proportion of British and median female earnings in the United States with a correlation coefficient (R) of -0.555 and weighted average of $39,772, a difference of 19.2%.
Median Female Earnings Correlation Summary
| Measurement | Yakama | British |
| Minimum | $23,214 | $7,631 |
| Maximum | $38,750 | $50,972 |
| Range | $15,536 | $43,341 |
| Mean | $31,429 | $35,190 |
| Median | $31,931 | $36,667 |
| Interquartile 25% (IQ1) | $27,516 | $27,044 |
| Interquartile 75% (IQ3) | $34,456 | $41,037 |
| Interquartile Range (IQR) | $6,940 | $13,994 |
| Standard Deviation (Sample) | $4,456 | $9,173 |
| Standard Deviation (Population) | $4,370 | $9,079 |
Similar Demographics by Median Female Earnings
Demographics Similar to Yakama by Median Female Earnings
In terms of median female earnings, the demographic groups most similar to Yakama are Ottawa ($33,378, a difference of 0.070%), Immigrants from Cuba ($33,291, a difference of 0.19%), Creek ($33,437, a difference of 0.25%), Immigrants from Mexico ($33,236, a difference of 0.36%), and Tohono O'odham ($33,205, a difference of 0.45%).
| Demographics | Rating | Rank | Median Female Earnings |
| Menominee | 0.0 /100 | #330 | Tragic $33,894 |
| Natives/Alaskans | 0.0 /100 | #331 | Tragic $33,806 |
| Choctaw | 0.0 /100 | #332 | Tragic $33,775 |
| Mexicans | 0.0 /100 | #333 | Tragic $33,664 |
| Spanish American Indians | 0.0 /100 | #334 | Tragic $33,625 |
| Creek | 0.0 /100 | #335 | Tragic $33,437 |
| Ottawa | 0.0 /100 | #336 | Tragic $33,378 |
| Yakama | 0.0 /100 | #337 | Tragic $33,354 |
| Immigrants | Cuba | 0.0 /100 | #338 | Tragic $33,291 |
| Immigrants | Mexico | 0.0 /100 | #339 | Tragic $33,236 |
| Tohono O'odham | 0.0 /100 | #340 | Tragic $33,205 |
| Navajo | 0.0 /100 | #341 | Tragic $33,046 |
| Yup'ik | 0.0 /100 | #342 | Tragic $32,730 |
| Pueblo | 0.0 /100 | #343 | Tragic $32,564 |
| Lumbee | 0.0 /100 | #344 | Tragic $32,500 |
Demographics Similar to British by Median Female Earnings
In terms of median female earnings, the demographic groups most similar to British are Immigrants from Portugal ($39,788, a difference of 0.040%), Slovene ($39,817, a difference of 0.11%), Canadian ($39,724, a difference of 0.12%), South American ($39,698, a difference of 0.19%), and Kenyan ($39,860, a difference of 0.22%).
| Demographics | Rating | Rank | Median Female Earnings |
| Immigrants | Bangladesh | 60.8 /100 | #165 | Good $39,910 |
| Immigrants | Ghana | 60.0 /100 | #166 | Good $39,894 |
| Luxembourgers | 59.9 /100 | #167 | Average $39,891 |
| Immigrants | Peru | 58.9 /100 | #168 | Average $39,871 |
| Kenyans | 58.4 /100 | #169 | Average $39,860 |
| Slovenes | 56.2 /100 | #170 | Average $39,817 |
| Immigrants | Portugal | 54.7 /100 | #171 | Average $39,788 |
| British | 53.8 /100 | #172 | Average $39,772 |
| Canadians | 51.4 /100 | #173 | Average $39,724 |
| South Americans | 50.0 /100 | #174 | Average $39,698 |
| Immigrants | South America | 47.2 /100 | #175 | Average $39,643 |
| Nigerians | 47.0 /100 | #176 | Average $39,641 |
| Costa Ricans | 46.1 /100 | #177 | Average $39,622 |
| Slavs | 45.6 /100 | #178 | Average $39,613 |
| Immigrants | Germany | 45.1 /100 | #179 | Average $39,603 |