Albanian vs British Median Female Earnings
COMPARE
Albanian
British
Median Female Earnings
Median Female Earnings Comparison
Albanians
British
$42,584
MEDIAN FEMALE EARNINGS
99.8/ 100
METRIC RATING
72nd/ 347
METRIC RANK
$39,772
MEDIAN FEMALE EARNINGS
53.8/ 100
METRIC RATING
172nd/ 347
METRIC RANK
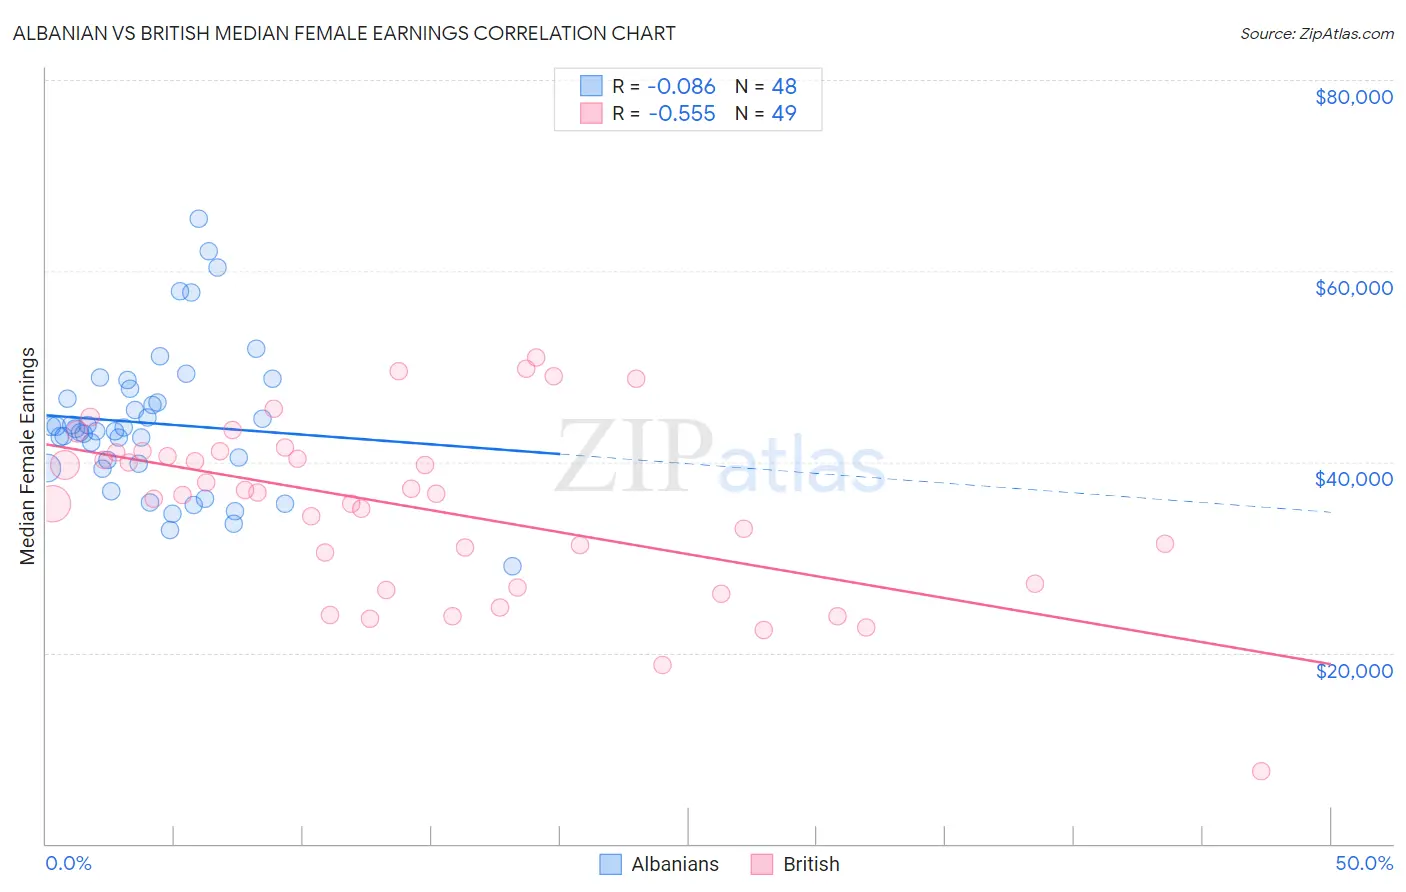
Albanian vs British Median Female Earnings Correlation Chart
The statistical analysis conducted on geographies consisting of 193,224,752 people shows a slight negative correlation between the proportion of Albanians and median female earnings in the United States with a correlation coefficient (R) of -0.086 and weighted average of $42,584. Similarly, the statistical analysis conducted on geographies consisting of 530,644,409 people shows a substantial negative correlation between the proportion of British and median female earnings in the United States with a correlation coefficient (R) of -0.555 and weighted average of $39,772, a difference of 7.1%.
Median Female Earnings Correlation Summary
| Measurement | Albanian | British |
| Minimum | $29,043 | $7,631 |
| Maximum | $65,406 | $50,972 |
| Range | $36,363 | $43,341 |
| Mean | $44,026 | $35,190 |
| Median | $43,361 | $36,667 |
| Interquartile 25% (IQ1) | $39,614 | $27,044 |
| Interquartile 75% (IQ3) | $47,094 | $41,037 |
| Interquartile Range (IQR) | $7,480 | $13,994 |
| Standard Deviation (Sample) | $7,618 | $9,173 |
| Standard Deviation (Population) | $7,538 | $9,079 |
Similar Demographics by Median Female Earnings
Demographics Similar to Albanians by Median Female Earnings
In terms of median female earnings, the demographic groups most similar to Albanians are Mongolian ($42,542, a difference of 0.10%), Immigrants from South Africa ($42,508, a difference of 0.18%), Immigrants from Romania ($42,718, a difference of 0.32%), New Zealander ($42,446, a difference of 0.32%), and Immigrants from Italy ($42,446, a difference of 0.33%).
| Demographics | Rating | Rank | Median Female Earnings |
| Sierra Leoneans | 99.9 /100 | #65 | Exceptional $42,868 |
| Immigrants | Norway | 99.9 /100 | #66 | Exceptional $42,837 |
| Immigrants | Egypt | 99.9 /100 | #67 | Exceptional $42,837 |
| Immigrants | Austria | 99.8 /100 | #68 | Exceptional $42,824 |
| Immigrants | Spain | 99.8 /100 | #69 | Exceptional $42,815 |
| Immigrants | Ethiopia | 99.8 /100 | #70 | Exceptional $42,744 |
| Immigrants | Romania | 99.8 /100 | #71 | Exceptional $42,718 |
| Albanians | 99.8 /100 | #72 | Exceptional $42,584 |
| Mongolians | 99.7 /100 | #73 | Exceptional $42,542 |
| Immigrants | South Africa | 99.7 /100 | #74 | Exceptional $42,508 |
| New Zealanders | 99.7 /100 | #75 | Exceptional $42,446 |
| Immigrants | Italy | 99.7 /100 | #76 | Exceptional $42,446 |
| Immigrants | Albania | 99.6 /100 | #77 | Exceptional $42,388 |
| Immigrants | Kazakhstan | 99.6 /100 | #78 | Exceptional $42,386 |
| Greeks | 99.6 /100 | #79 | Exceptional $42,336 |
Demographics Similar to British by Median Female Earnings
In terms of median female earnings, the demographic groups most similar to British are Immigrants from Portugal ($39,788, a difference of 0.040%), Slovene ($39,817, a difference of 0.11%), Canadian ($39,724, a difference of 0.12%), South American ($39,698, a difference of 0.19%), and Kenyan ($39,860, a difference of 0.22%).
| Demographics | Rating | Rank | Median Female Earnings |
| Immigrants | Bangladesh | 60.8 /100 | #165 | Good $39,910 |
| Immigrants | Ghana | 60.0 /100 | #166 | Good $39,894 |
| Luxembourgers | 59.9 /100 | #167 | Average $39,891 |
| Immigrants | Peru | 58.9 /100 | #168 | Average $39,871 |
| Kenyans | 58.4 /100 | #169 | Average $39,860 |
| Slovenes | 56.2 /100 | #170 | Average $39,817 |
| Immigrants | Portugal | 54.7 /100 | #171 | Average $39,788 |
| British | 53.8 /100 | #172 | Average $39,772 |
| Canadians | 51.4 /100 | #173 | Average $39,724 |
| South Americans | 50.0 /100 | #174 | Average $39,698 |
| Immigrants | South America | 47.2 /100 | #175 | Average $39,643 |
| Nigerians | 47.0 /100 | #176 | Average $39,641 |
| Costa Ricans | 46.1 /100 | #177 | Average $39,622 |
| Slavs | 45.6 /100 | #178 | Average $39,613 |
| Immigrants | Germany | 45.1 /100 | #179 | Average $39,603 |