Nepalese vs Osage College, 1 year or more
COMPARE
Nepalese
Osage
College, 1 year or more
College, 1 year or more Comparison
Nepalese
Osage
54.9%
COLLEGE, 1 YEAR OR MORE
0.3/ 100
METRIC RATING
259th/ 347
METRIC RANK
55.8%
COLLEGE, 1 YEAR OR MORE
1.0/ 100
METRIC RATING
243rd/ 347
METRIC RANK
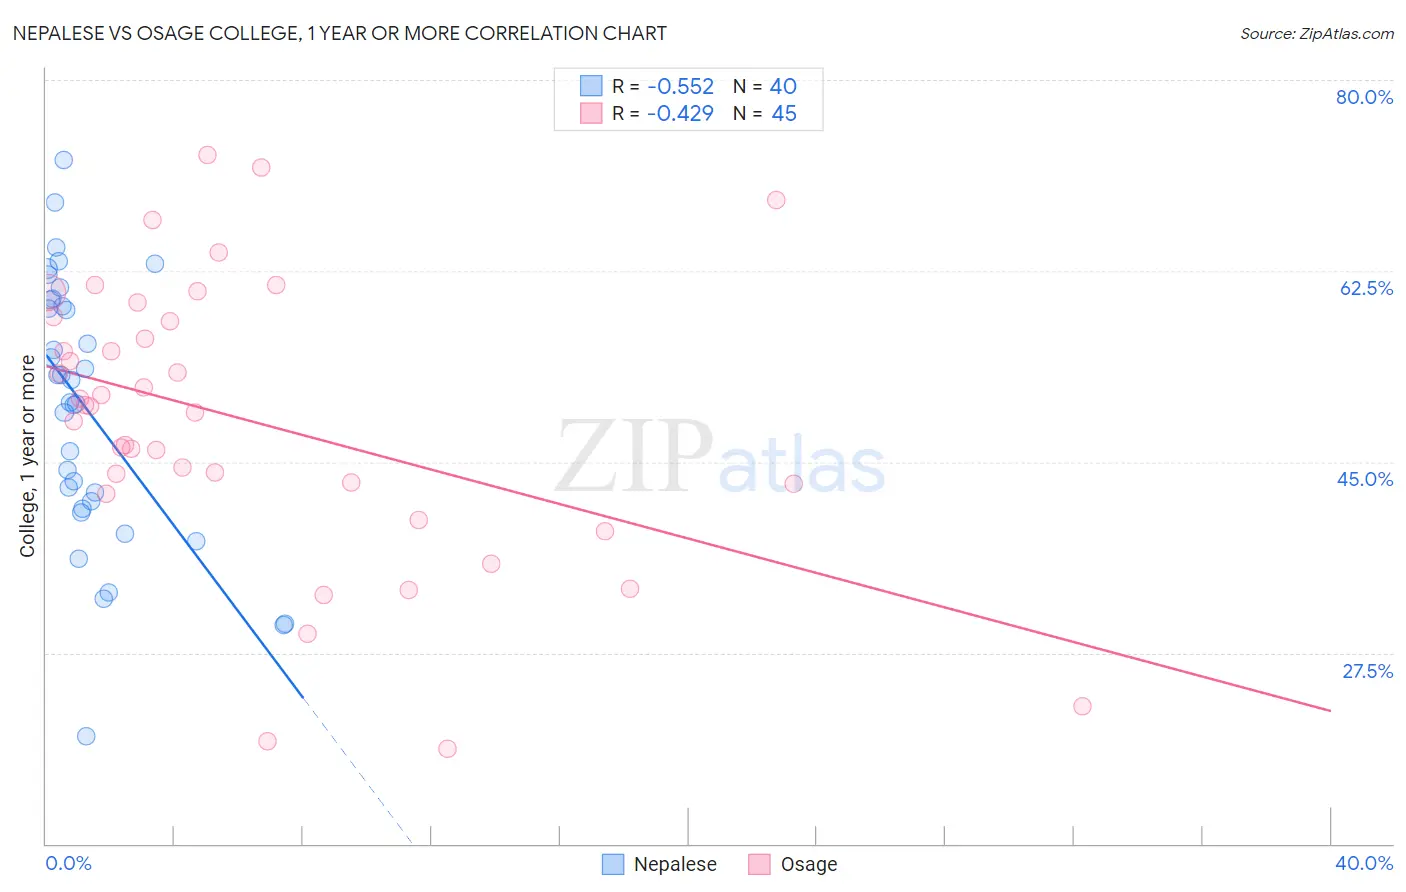
Nepalese vs Osage College, 1 year or more Correlation Chart
The statistical analysis conducted on geographies consisting of 24,521,755 people shows a substantial negative correlation between the proportion of Nepalese and percentage of population with at least college, 1 year or more education in the United States with a correlation coefficient (R) of -0.552 and weighted average of 54.9%. Similarly, the statistical analysis conducted on geographies consisting of 91,808,929 people shows a moderate negative correlation between the proportion of Osage and percentage of population with at least college, 1 year or more education in the United States with a correlation coefficient (R) of -0.429 and weighted average of 55.8%, a difference of 1.5%.
College, 1 year or more Correlation Summary
| Measurement | Nepalese | Osage |
| Minimum | 19.8% | 18.8% |
| Maximum | 72.6% | 73.1% |
| Range | 52.8% | 54.3% |
| Mean | 49.8% | 48.7% |
| Median | 51.5% | 50.1% |
| Interquartile 25% (IQ1) | 41.1% | 42.6% |
| Interquartile 75% (IQ3) | 59.5% | 58.1% |
| Interquartile Range (IQR) | 18.5% | 15.5% |
| Standard Deviation (Sample) | 12.1% | 12.9% |
| Standard Deviation (Population) | 11.9% | 12.8% |
Demographics Similar to Nepalese and Osage by College, 1 year or more
In terms of college, 1 year or more, the demographic groups most similar to Nepalese are African (55.0%, a difference of 0.060%), Jamaican (54.9%, a difference of 0.10%), Ottawa (54.9%, a difference of 0.13%), Indonesian (55.1%, a difference of 0.34%), and Immigrants from West Indies (55.2%, a difference of 0.44%). Similarly, the demographic groups most similar to Osage are Marshallese (55.8%, a difference of 0.010%), French American Indian (55.8%, a difference of 0.12%), Chippewa (55.7%, a difference of 0.12%), Immigrants from Liberia (55.7%, a difference of 0.19%), and Malaysian (55.6%, a difference of 0.23%).
| Demographics | Rating | Rank | College, 1 year or more |
| French American Indians | 1.0 /100 | #241 | Tragic 55.8% |
| Marshallese | 1.0 /100 | #242 | Tragic 55.8% |
| Osage | 1.0 /100 | #243 | Tragic 55.8% |
| Chippewa | 0.9 /100 | #244 | Tragic 55.7% |
| Immigrants | Liberia | 0.8 /100 | #245 | Tragic 55.7% |
| Malaysians | 0.8 /100 | #246 | Tragic 55.6% |
| Hawaiians | 0.8 /100 | #247 | Tragic 55.6% |
| Immigrants | Congo | 0.8 /100 | #248 | Tragic 55.6% |
| Immigrants | Trinidad and Tobago | 0.7 /100 | #249 | Tragic 55.5% |
| Delaware | 0.7 /100 | #250 | Tragic 55.5% |
| Immigrants | Cambodia | 0.6 /100 | #251 | Tragic 55.4% |
| Aleuts | 0.6 /100 | #252 | Tragic 55.4% |
| Immigrants | Barbados | 0.6 /100 | #253 | Tragic 55.4% |
| Japanese | 0.5 /100 | #254 | Tragic 55.2% |
| Immigrants | Bahamas | 0.5 /100 | #255 | Tragic 55.2% |
| Immigrants | West Indies | 0.5 /100 | #256 | Tragic 55.2% |
| Indonesians | 0.4 /100 | #257 | Tragic 55.1% |
| Africans | 0.4 /100 | #258 | Tragic 55.0% |
| Nepalese | 0.3 /100 | #259 | Tragic 54.9% |
| Jamaicans | 0.3 /100 | #260 | Tragic 54.9% |
| Ottawa | 0.3 /100 | #261 | Tragic 54.9% |