Immigrants from Venezuela vs Osage Median Female Earnings
COMPARE
Immigrants from Venezuela
Osage
Median Female Earnings
Median Female Earnings Comparison
Immigrants from Venezuela
Osage
$37,003
MEDIAN FEMALE EARNINGS
0.4/ 100
METRIC RATING
269th/ 347
METRIC RANK
$36,034
MEDIAN FEMALE EARNINGS
0.0/ 100
METRIC RATING
286th/ 347
METRIC RANK
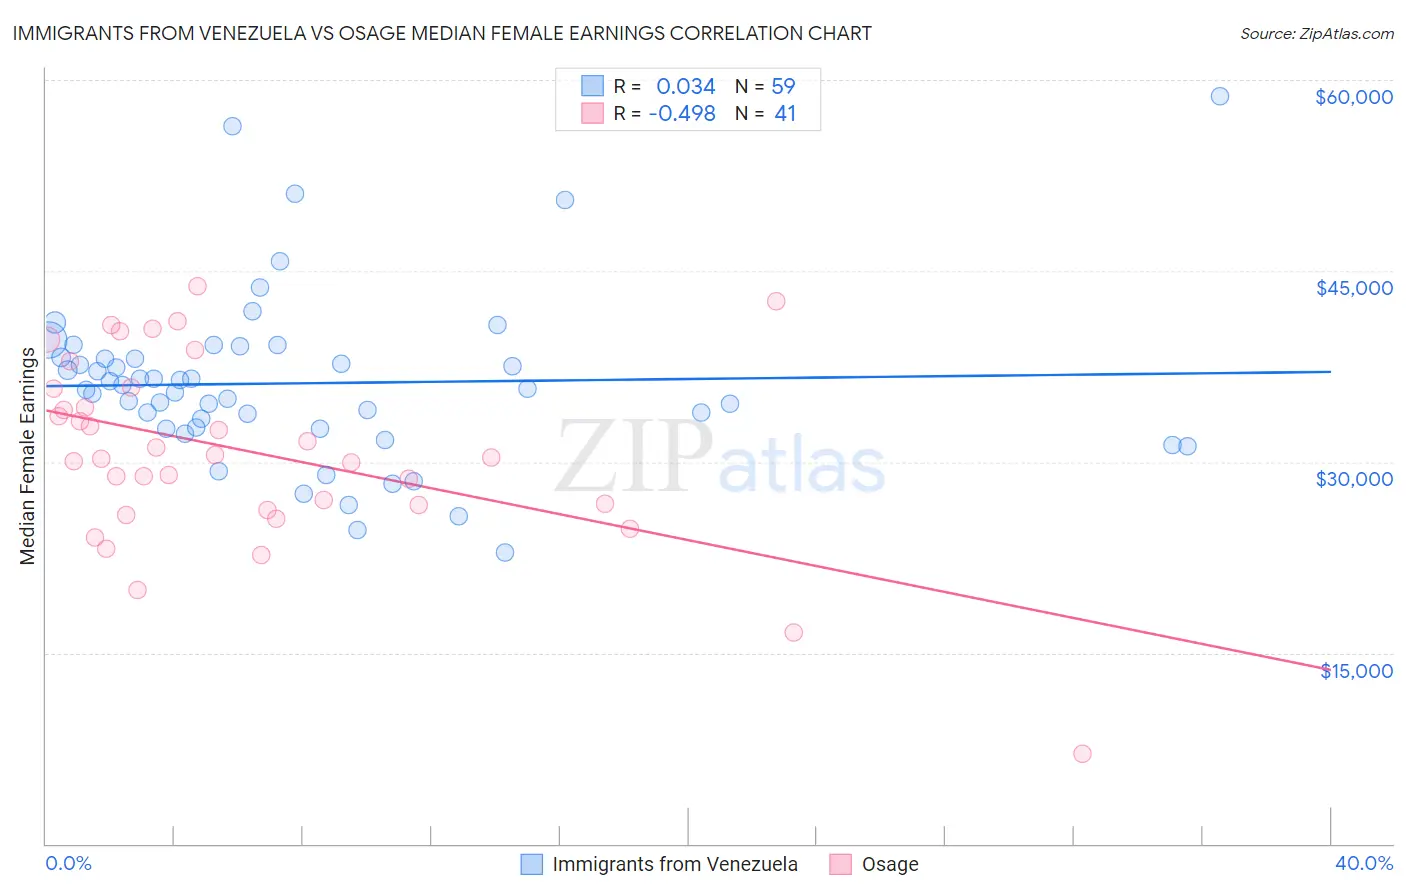
Immigrants from Venezuela vs Osage Median Female Earnings Correlation Chart
The statistical analysis conducted on geographies consisting of 287,813,755 people shows no correlation between the proportion of Immigrants from Venezuela and median female earnings in the United States with a correlation coefficient (R) of 0.034 and weighted average of $37,003. Similarly, the statistical analysis conducted on geographies consisting of 91,783,866 people shows a moderate negative correlation between the proportion of Osage and median female earnings in the United States with a correlation coefficient (R) of -0.498 and weighted average of $36,034, a difference of 2.7%.
Median Female Earnings Correlation Summary
| Measurement | Immigrants from Venezuela | Osage |
| Minimum | $22,864 | $7,083 |
| Maximum | $58,709 | $43,750 |
| Range | $35,845 | $36,667 |
| Mean | $36,176 | $30,795 |
| Median | $35,750 | $30,332 |
| Interquartile 25% (IQ1) | $32,617 | $26,425 |
| Interquartile 75% (IQ3) | $38,204 | $35,787 |
| Interquartile Range (IQR) | $5,588 | $9,362 |
| Standard Deviation (Sample) | $6,703 | $7,435 |
| Standard Deviation (Population) | $6,646 | $7,343 |
Demographics Similar to Immigrants from Venezuela and Osage by Median Female Earnings
In terms of median female earnings, the demographic groups most similar to Immigrants from Venezuela are Cree ($37,018, a difference of 0.040%), Nonimmigrants ($37,024, a difference of 0.060%), French American Indian ($36,920, a difference of 0.23%), Nicaraguan ($36,904, a difference of 0.27%), and Immigrants from Dominican Republic ($36,857, a difference of 0.39%). Similarly, the demographic groups most similar to Osage are Immigrants from Nicaragua ($36,023, a difference of 0.030%), Paiute ($36,056, a difference of 0.060%), Indonesian ($36,140, a difference of 0.29%), Immigrants from Haiti ($36,203, a difference of 0.47%), and Haitian ($36,374, a difference of 0.94%).
| Demographics | Rating | Rank | Median Female Earnings |
| Immigrants | Nonimmigrants | 0.4 /100 | #267 | Tragic $37,024 |
| Cree | 0.4 /100 | #268 | Tragic $37,018 |
| Immigrants | Venezuela | 0.4 /100 | #269 | Tragic $37,003 |
| French American Indians | 0.3 /100 | #270 | Tragic $36,920 |
| Nicaraguans | 0.3 /100 | #271 | Tragic $36,904 |
| Immigrants | Dominican Republic | 0.3 /100 | #272 | Tragic $36,857 |
| Immigrants | Laos | 0.3 /100 | #273 | Tragic $36,841 |
| Immigrants | El Salvador | 0.2 /100 | #274 | Tragic $36,673 |
| Africans | 0.1 /100 | #275 | Tragic $36,530 |
| Central Americans | 0.1 /100 | #276 | Tragic $36,492 |
| Marshallese | 0.1 /100 | #277 | Tragic $36,459 |
| U.S. Virgin Islanders | 0.1 /100 | #278 | Tragic $36,424 |
| Immigrants | Caribbean | 0.1 /100 | #279 | Tragic $36,414 |
| Iroquois | 0.1 /100 | #280 | Tragic $36,408 |
| Spanish Americans | 0.1 /100 | #281 | Tragic $36,391 |
| Haitians | 0.1 /100 | #282 | Tragic $36,374 |
| Immigrants | Haiti | 0.1 /100 | #283 | Tragic $36,203 |
| Indonesians | 0.1 /100 | #284 | Tragic $36,140 |
| Paiute | 0.1 /100 | #285 | Tragic $36,056 |
| Osage | 0.0 /100 | #286 | Tragic $36,034 |
| Immigrants | Nicaragua | 0.0 /100 | #287 | Tragic $36,023 |