Paraguayan vs Osage Median Female Earnings
COMPARE
Paraguayan
Osage
Median Female Earnings
Median Female Earnings Comparison
Paraguayans
Osage
$43,173
MEDIAN FEMALE EARNINGS
99.9/ 100
METRIC RATING
58th/ 347
METRIC RANK
$36,034
MEDIAN FEMALE EARNINGS
0.0/ 100
METRIC RATING
286th/ 347
METRIC RANK
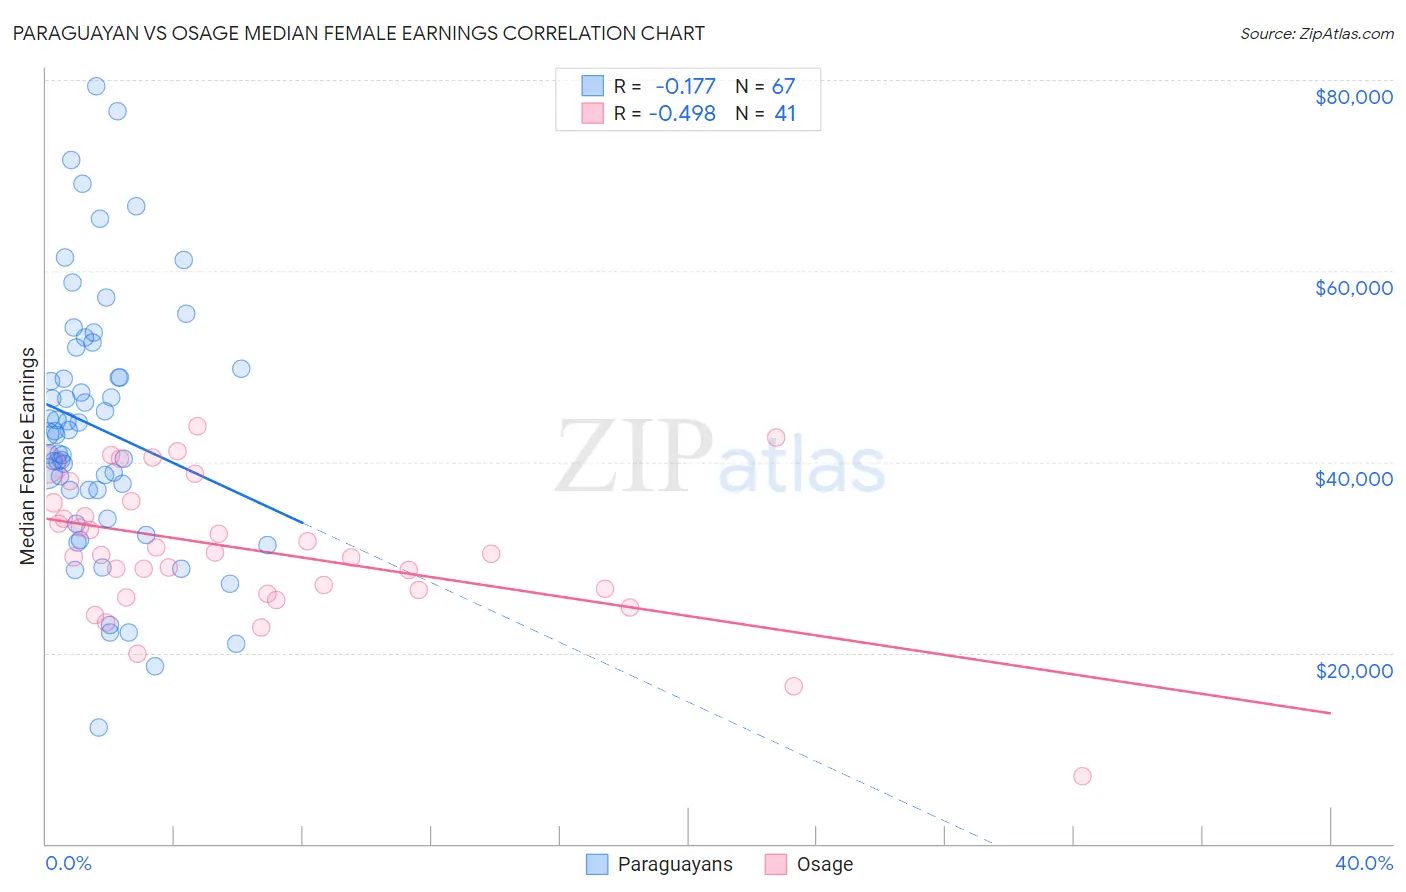
Paraguayan vs Osage Median Female Earnings Correlation Chart
The statistical analysis conducted on geographies consisting of 95,111,705 people shows a poor negative correlation between the proportion of Paraguayans and median female earnings in the United States with a correlation coefficient (R) of -0.177 and weighted average of $43,173. Similarly, the statistical analysis conducted on geographies consisting of 91,783,866 people shows a moderate negative correlation between the proportion of Osage and median female earnings in the United States with a correlation coefficient (R) of -0.498 and weighted average of $36,034, a difference of 19.8%.
Median Female Earnings Correlation Summary
| Measurement | Paraguayan | Osage |
| Minimum | $12,152 | $7,083 |
| Maximum | $79,410 | $43,750 |
| Range | $67,258 | $36,667 |
| Mean | $43,505 | $30,795 |
| Median | $42,896 | $30,332 |
| Interquartile 25% (IQ1) | $37,010 | $26,425 |
| Interquartile 75% (IQ3) | $49,789 | $35,787 |
| Interquartile Range (IQR) | $12,779 | $9,362 |
| Standard Deviation (Sample) | $13,576 | $7,435 |
| Standard Deviation (Population) | $13,475 | $7,343 |
Similar Demographics by Median Female Earnings
Demographics Similar to Paraguayans by Median Female Earnings
In terms of median female earnings, the demographic groups most similar to Paraguayans are Ethiopian ($43,243, a difference of 0.16%), Estonian ($43,106, a difference of 0.16%), Immigrants from Latvia ($43,099, a difference of 0.17%), Immigrants from Croatia ($43,258, a difference of 0.20%), and Immigrants from Bulgaria ($43,085, a difference of 0.20%).
| Demographics | Rating | Rank | Median Female Earnings |
| Maltese | 100.0 /100 | #51 | Exceptional $43,357 |
| Immigrants | Lithuania | 99.9 /100 | #52 | Exceptional $43,317 |
| Immigrants | Eastern Europe | 99.9 /100 | #53 | Exceptional $43,309 |
| Australians | 99.9 /100 | #54 | Exceptional $43,308 |
| Egyptians | 99.9 /100 | #55 | Exceptional $43,305 |
| Immigrants | Croatia | 99.9 /100 | #56 | Exceptional $43,258 |
| Ethiopians | 99.9 /100 | #57 | Exceptional $43,243 |
| Paraguayans | 99.9 /100 | #58 | Exceptional $43,173 |
| Estonians | 99.9 /100 | #59 | Exceptional $43,106 |
| Immigrants | Latvia | 99.9 /100 | #60 | Exceptional $43,099 |
| Immigrants | Bulgaria | 99.9 /100 | #61 | Exceptional $43,085 |
| Afghans | 99.9 /100 | #62 | Exceptional $43,077 |
| Immigrants | Ukraine | 99.9 /100 | #63 | Exceptional $43,069 |
| Immigrants | Pakistan | 99.9 /100 | #64 | Exceptional $43,052 |
| Sierra Leoneans | 99.9 /100 | #65 | Exceptional $42,868 |
Demographics Similar to Osage by Median Female Earnings
In terms of median female earnings, the demographic groups most similar to Osage are Immigrants from Nicaragua ($36,023, a difference of 0.030%), Immigrants from Zaire ($36,017, a difference of 0.050%), Paiute ($36,056, a difference of 0.060%), Bangladeshi ($35,960, a difference of 0.21%), and Indonesian ($36,140, a difference of 0.29%).
| Demographics | Rating | Rank | Median Female Earnings |
| Immigrants | Caribbean | 0.1 /100 | #279 | Tragic $36,414 |
| Iroquois | 0.1 /100 | #280 | Tragic $36,408 |
| Spanish Americans | 0.1 /100 | #281 | Tragic $36,391 |
| Haitians | 0.1 /100 | #282 | Tragic $36,374 |
| Immigrants | Haiti | 0.1 /100 | #283 | Tragic $36,203 |
| Indonesians | 0.1 /100 | #284 | Tragic $36,140 |
| Paiute | 0.1 /100 | #285 | Tragic $36,056 |
| Osage | 0.0 /100 | #286 | Tragic $36,034 |
| Immigrants | Nicaragua | 0.0 /100 | #287 | Tragic $36,023 |
| Immigrants | Zaire | 0.0 /100 | #288 | Tragic $36,017 |
| Bangladeshis | 0.0 /100 | #289 | Tragic $35,960 |
| Central American Indians | 0.0 /100 | #290 | Tragic $35,930 |
| Blackfeet | 0.0 /100 | #291 | Tragic $35,864 |
| Americans | 0.0 /100 | #292 | Tragic $35,777 |
| Guatemalans | 0.0 /100 | #293 | Tragic $35,695 |