Nepalese vs Osage Single Mother Households
COMPARE
Nepalese
Osage
Single Mother Households
Single Mother Households Comparison
Nepalese
Osage
7.5%
SINGLE MOTHER HOUSEHOLDS
0.1/ 100
METRIC RATING
266th/ 347
METRIC RANK
6.4%
SINGLE MOTHER HOUSEHOLDS
43.0/ 100
METRIC RATING
177th/ 347
METRIC RANK
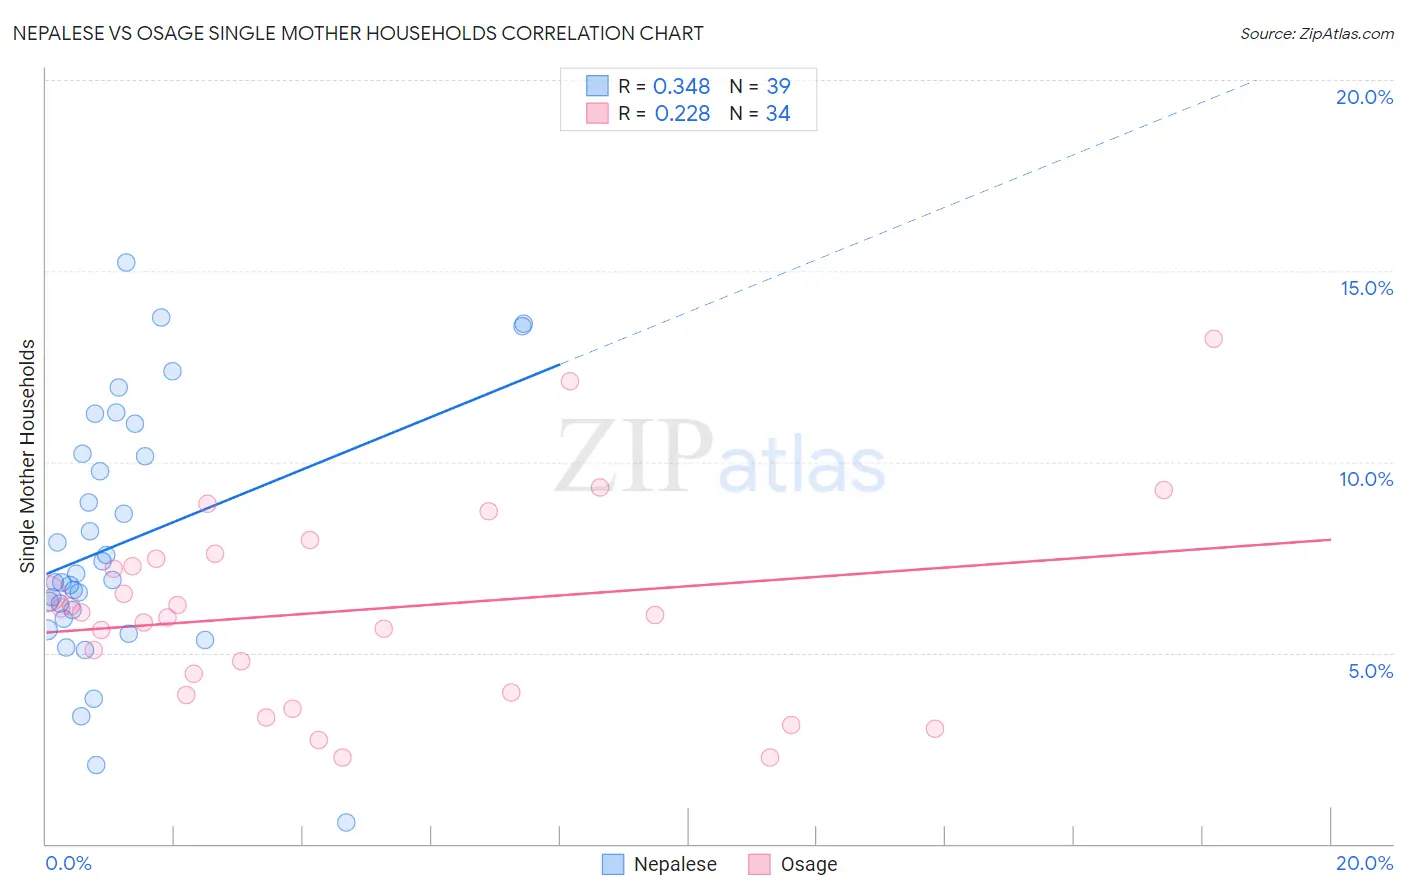
Nepalese vs Osage Single Mother Households Correlation Chart
The statistical analysis conducted on geographies consisting of 24,517,800 people shows a mild positive correlation between the proportion of Nepalese and percentage of single mother households in the United States with a correlation coefficient (R) of 0.348 and weighted average of 7.5%. Similarly, the statistical analysis conducted on geographies consisting of 91,762,553 people shows a weak positive correlation between the proportion of Osage and percentage of single mother households in the United States with a correlation coefficient (R) of 0.228 and weighted average of 6.4%, a difference of 17.2%.
Single Mother Households Correlation Summary
| Measurement | Nepalese | Osage |
| Minimum | 0.56% | 2.2% |
| Maximum | 15.2% | 13.2% |
| Range | 14.7% | 11.0% |
| Mean | 7.9% | 6.1% |
| Median | 6.9% | 6.0% |
| Interquartile 25% (IQ1) | 5.9% | 4.0% |
| Interquartile 75% (IQ3) | 10.2% | 7.5% |
| Interquartile Range (IQR) | 4.3% | 3.5% |
| Standard Deviation (Sample) | 3.3% | 2.6% |
| Standard Deviation (Population) | 3.3% | 2.6% |
Similar Demographics by Single Mother Households
Demographics Similar to Nepalese by Single Mother Households
In terms of single mother households, the demographic groups most similar to Nepalese are Crow (7.4%, a difference of 0.090%), Yaqui (7.4%, a difference of 0.27%), Blackfeet (7.5%, a difference of 0.34%), Immigrants from Nicaragua (7.4%, a difference of 0.35%), and Indonesian (7.5%, a difference of 0.38%).
| Demographics | Rating | Rank | Single Mother Households |
| Immigrants | Yemen | 0.2 /100 | #259 | Tragic 7.4% |
| Immigrants | Zaire | 0.2 /100 | #260 | Tragic 7.4% |
| Japanese | 0.2 /100 | #261 | Tragic 7.4% |
| Immigrants | Somalia | 0.2 /100 | #262 | Tragic 7.4% |
| Immigrants | Nicaragua | 0.2 /100 | #263 | Tragic 7.4% |
| Yaqui | 0.1 /100 | #264 | Tragic 7.4% |
| Crow | 0.1 /100 | #265 | Tragic 7.4% |
| Nepalese | 0.1 /100 | #266 | Tragic 7.5% |
| Blackfeet | 0.1 /100 | #267 | Tragic 7.5% |
| Indonesians | 0.1 /100 | #268 | Tragic 7.5% |
| Somalis | 0.1 /100 | #269 | Tragic 7.5% |
| Immigrants | Cuba | 0.1 /100 | #270 | Tragic 7.5% |
| Salvadorans | 0.1 /100 | #271 | Tragic 7.5% |
| Immigrants | Azores | 0.1 /100 | #272 | Tragic 7.5% |
| Belizeans | 0.1 /100 | #273 | Tragic 7.6% |
Demographics Similar to Osage by Single Mother Households
In terms of single mother households, the demographic groups most similar to Osage are Immigrants from Bosnia and Herzegovina (6.3%, a difference of 0.14%), Marshallese (6.3%, a difference of 0.30%), Portuguese (6.4%, a difference of 0.34%), Hmong (6.4%, a difference of 0.36%), and Immigrants from Morocco (6.3%, a difference of 0.77%).
| Demographics | Rating | Rank | Single Mother Households |
| Immigrants | Oceania | 54.6 /100 | #170 | Average 6.3% |
| Afghans | 52.5 /100 | #171 | Average 6.3% |
| Immigrants | South Eastern Asia | 52.2 /100 | #172 | Average 6.3% |
| Immigrants | Vietnam | 51.5 /100 | #173 | Average 6.3% |
| Immigrants | Morocco | 50.0 /100 | #174 | Average 6.3% |
| Marshallese | 45.8 /100 | #175 | Average 6.3% |
| Immigrants | Bosnia and Herzegovina | 44.3 /100 | #176 | Average 6.3% |
| Osage | 43.0 /100 | #177 | Average 6.4% |
| Portuguese | 40.0 /100 | #178 | Fair 6.4% |
| Hmong | 39.8 /100 | #179 | Fair 6.4% |
| Immigrants | Nepal | 36.1 /100 | #180 | Fair 6.4% |
| Spanish | 33.4 /100 | #181 | Fair 6.4% |
| South American Indians | 33.4 /100 | #182 | Fair 6.4% |
| Spaniards | 27.8 /100 | #183 | Fair 6.5% |
| Ethiopians | 26.0 /100 | #184 | Fair 6.5% |