Nepalese vs Immigrants from Haiti Currently Married
COMPARE
Nepalese
Immigrants from Haiti
Currently Married
Currently Married Comparison
Nepalese
Immigrants from Haiti
44.7%
CURRENTLY MARRIED
1.2/ 100
METRIC RATING
232nd/ 347
METRIC RANK
41.0%
CURRENTLY MARRIED
0.0/ 100
METRIC RATING
322nd/ 347
METRIC RANK
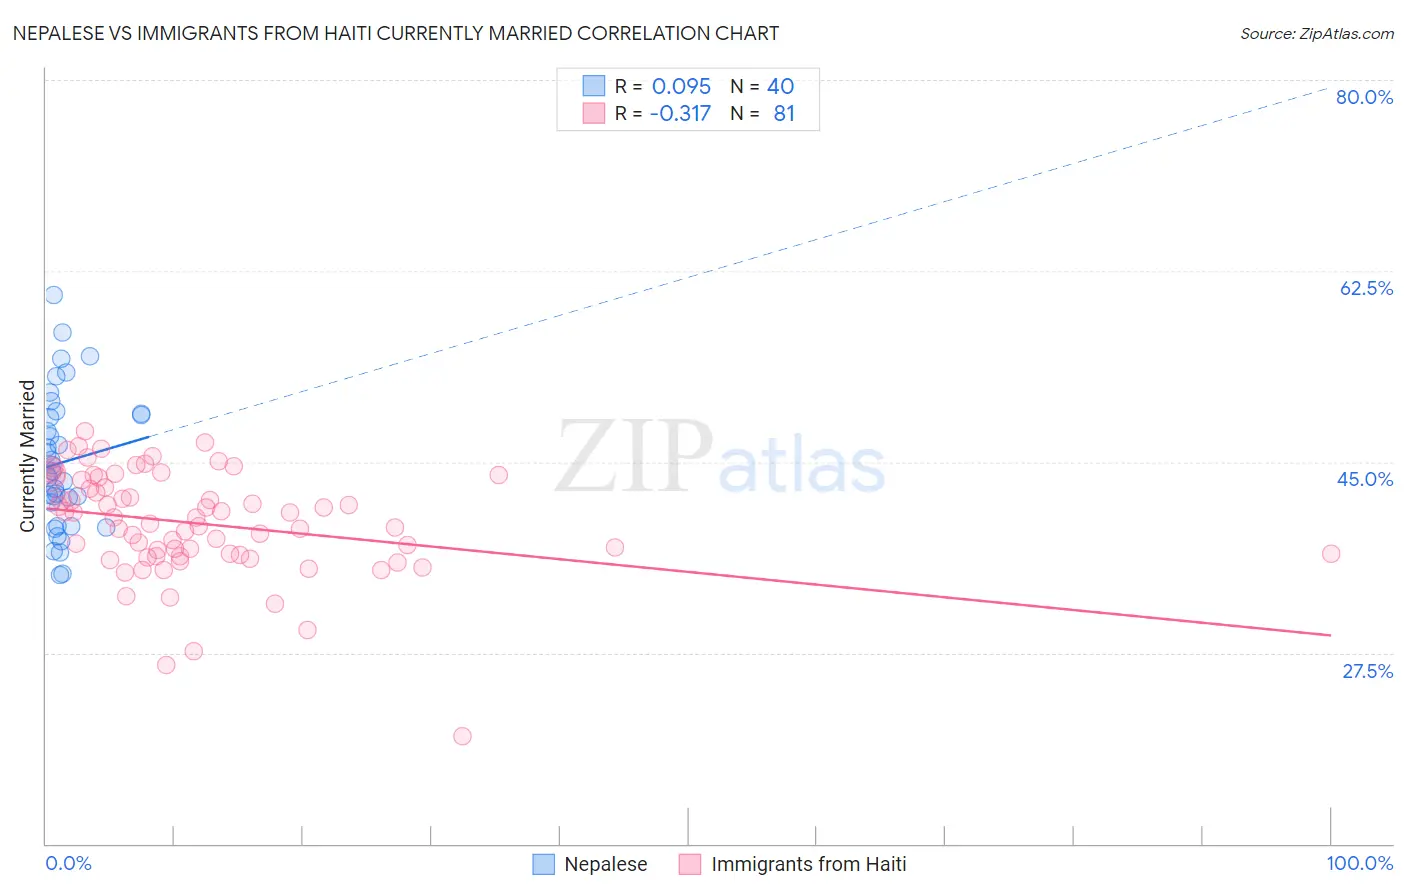
Nepalese vs Immigrants from Haiti Currently Married Correlation Chart
The statistical analysis conducted on geographies consisting of 24,521,755 people shows a slight positive correlation between the proportion of Nepalese and percentage of population currently married in the United States with a correlation coefficient (R) of 0.095 and weighted average of 44.7%. Similarly, the statistical analysis conducted on geographies consisting of 225,264,174 people shows a mild negative correlation between the proportion of Immigrants from Haiti and percentage of population currently married in the United States with a correlation coefficient (R) of -0.317 and weighted average of 41.0%, a difference of 9.1%.
Currently Married Correlation Summary
| Measurement | Nepalese | Immigrants from Haiti |
| Minimum | 34.6% | 19.9% |
| Maximum | 60.3% | 47.8% |
| Range | 25.7% | 27.9% |
| Mean | 45.0% | 39.3% |
| Median | 44.0% | 39.9% |
| Interquartile 25% (IQ1) | 40.2% | 36.4% |
| Interquartile 75% (IQ3) | 49.3% | 43.5% |
| Interquartile Range (IQR) | 9.2% | 7.1% |
| Standard Deviation (Sample) | 6.2% | 4.9% |
| Standard Deviation (Population) | 6.2% | 4.9% |
Similar Demographics by Currently Married
Demographics Similar to Nepalese by Currently Married
In terms of currently married, the demographic groups most similar to Nepalese are Immigrants from Saudi Arabia (44.7%, a difference of 0.050%), Iroquois (44.7%, a difference of 0.060%), Alaskan Athabascan (44.6%, a difference of 0.21%), Cuban (44.6%, a difference of 0.22%), and Seminole (44.6%, a difference of 0.23%).
| Demographics | Rating | Rank | Currently Married |
| French American Indians | 2.2 /100 | #225 | Tragic 45.0% |
| Comanche | 2.1 /100 | #226 | Tragic 45.0% |
| Spanish Americans | 2.1 /100 | #227 | Tragic 45.0% |
| Immigrants | Uruguay | 2.0 /100 | #228 | Tragic 45.0% |
| Cree | 1.7 /100 | #229 | Tragic 44.9% |
| Immigrants | Kenya | 1.6 /100 | #230 | Tragic 44.9% |
| Immigrants | Panama | 1.5 /100 | #231 | Tragic 44.9% |
| Nepalese | 1.2 /100 | #232 | Tragic 44.7% |
| Immigrants | Saudi Arabia | 1.1 /100 | #233 | Tragic 44.7% |
| Iroquois | 1.1 /100 | #234 | Tragic 44.7% |
| Alaskan Athabascans | 0.9 /100 | #235 | Tragic 44.6% |
| Cubans | 0.9 /100 | #236 | Tragic 44.6% |
| Seminole | 0.9 /100 | #237 | Tragic 44.6% |
| Moroccans | 0.9 /100 | #238 | Tragic 44.6% |
| Immigrants | Mexico | 0.7 /100 | #239 | Tragic 44.5% |
Demographics Similar to Immigrants from Haiti by Currently Married
In terms of currently married, the demographic groups most similar to Immigrants from Haiti are Immigrants from Congo (41.1%, a difference of 0.13%), Immigrants from Jamaica (41.1%, a difference of 0.36%), Immigrants from Somalia (41.2%, a difference of 0.43%), Bahamian (41.2%, a difference of 0.44%), and Haitian (41.3%, a difference of 0.63%).
| Demographics | Rating | Rank | Currently Married |
| Inupiat | 0.0 /100 | #315 | Tragic 41.3% |
| Immigrants | Caribbean | 0.0 /100 | #316 | Tragic 41.3% |
| Haitians | 0.0 /100 | #317 | Tragic 41.3% |
| Bahamians | 0.0 /100 | #318 | Tragic 41.2% |
| Immigrants | Somalia | 0.0 /100 | #319 | Tragic 41.2% |
| Immigrants | Jamaica | 0.0 /100 | #320 | Tragic 41.1% |
| Immigrants | Congo | 0.0 /100 | #321 | Tragic 41.1% |
| Immigrants | Haiti | 0.0 /100 | #322 | Tragic 41.0% |
| Immigrants | West Indies | 0.0 /100 | #323 | Tragic 40.7% |
| Immigrants | Senegal | 0.0 /100 | #324 | Tragic 40.7% |
| U.S. Virgin Islanders | 0.0 /100 | #325 | Tragic 40.7% |
| Barbadians | 0.0 /100 | #326 | Tragic 40.6% |
| Senegalese | 0.0 /100 | #327 | Tragic 40.6% |
| Arapaho | 0.0 /100 | #328 | Tragic 40.5% |
| Crow | 0.0 /100 | #329 | Tragic 40.4% |