Mexican American Indian vs Cheyenne No Vehicles in Household
COMPARE
Mexican American Indian
Cheyenne
No Vehicles in Household
No Vehicles in Household Comparison
Mexican American Indians
Cheyenne
9.1%
NO VEHICLES IN HOUSEHOLD
97.6/ 100
METRIC RATING
108th/ 347
METRIC RANK
11.7%
NO VEHICLES IN HOUSEHOLD
2.4/ 100
METRIC RATING
243rd/ 347
METRIC RANK
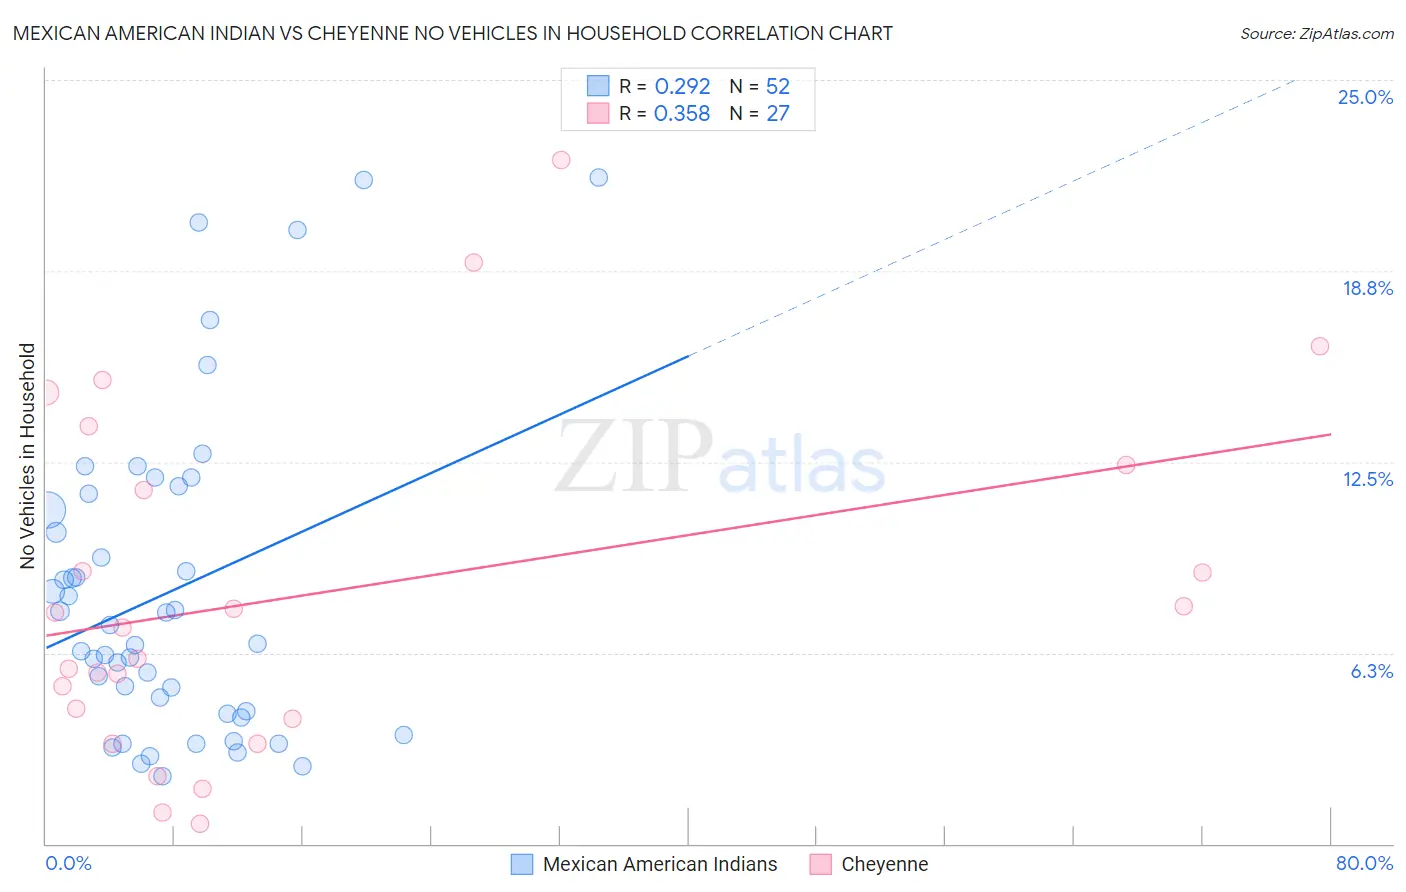
Mexican American Indian vs Cheyenne No Vehicles in Household Correlation Chart
The statistical analysis conducted on geographies consisting of 317,109,278 people shows a weak positive correlation between the proportion of Mexican American Indians and percentage of households with no vehicle available in the United States with a correlation coefficient (R) of 0.292 and weighted average of 9.1%. Similarly, the statistical analysis conducted on geographies consisting of 80,645,180 people shows a mild positive correlation between the proportion of Cheyenne and percentage of households with no vehicle available in the United States with a correlation coefficient (R) of 0.358 and weighted average of 11.7%, a difference of 28.8%.
No Vehicles in Household Correlation Summary
| Measurement | Mexican American Indian | Cheyenne |
| Minimum | 2.2% | 0.64% |
| Maximum | 21.8% | 22.4% |
| Range | 19.6% | 21.7% |
| Mean | 8.2% | 8.2% |
| Median | 6.8% | 7.1% |
| Interquartile 25% (IQ1) | 4.3% | 4.1% |
| Interquartile 75% (IQ3) | 11.2% | 12.4% |
| Interquartile Range (IQR) | 6.9% | 8.3% |
| Standard Deviation (Sample) | 5.1% | 5.7% |
| Standard Deviation (Population) | 5.1% | 5.6% |
Similar Demographics by No Vehicles in Household
Demographics Similar to Mexican American Indians by No Vehicles in Household
In terms of no vehicles in household, the demographic groups most similar to Mexican American Indians are Hispanic or Latino (9.1%, a difference of 0.080%), Maltese (9.1%, a difference of 0.13%), Laotian (9.1%, a difference of 0.35%), Spanish American (9.1%, a difference of 0.44%), and Zimbabwean (9.0%, a difference of 0.60%).
| Demographics | Rating | Rank | No Vehicles in Household |
| Pakistanis | 98.3 /100 | #101 | Exceptional 9.0% |
| Yugoslavians | 98.3 /100 | #102 | Exceptional 9.0% |
| Seminole | 98.3 /100 | #103 | Exceptional 9.0% |
| Zimbabweans | 98.0 /100 | #104 | Exceptional 9.0% |
| Spanish Americans | 97.9 /100 | #105 | Exceptional 9.1% |
| Laotians | 97.8 /100 | #106 | Exceptional 9.1% |
| Hispanics or Latinos | 97.7 /100 | #107 | Exceptional 9.1% |
| Mexican American Indians | 97.6 /100 | #108 | Exceptional 9.1% |
| Maltese | 97.6 /100 | #109 | Exceptional 9.1% |
| Delaware | 97.2 /100 | #110 | Exceptional 9.2% |
| Immigrants | Kuwait | 95.1 /100 | #111 | Exceptional 9.4% |
| Armenians | 95.0 /100 | #112 | Exceptional 9.4% |
| Immigrants | Netherlands | 94.8 /100 | #113 | Exceptional 9.4% |
| Serbians | 94.3 /100 | #114 | Exceptional 9.4% |
| Navajo | 94.2 /100 | #115 | Exceptional 9.4% |
Demographics Similar to Cheyenne by No Vehicles in Household
In terms of no vehicles in household, the demographic groups most similar to Cheyenne are Immigrants from Portugal (11.7%, a difference of 0.18%), Turkish (11.7%, a difference of 0.33%), Immigrants from Honduras (11.8%, a difference of 0.37%), Eastern European (11.7%, a difference of 0.44%), and Immigrants (11.7%, a difference of 0.45%).
| Demographics | Rating | Rank | No Vehicles in Household |
| Cree | 3.5 /100 | #236 | Tragic 11.6% |
| Ute | 3.3 /100 | #237 | Tragic 11.6% |
| Russians | 3.2 /100 | #238 | Tragic 11.6% |
| Taiwanese | 2.8 /100 | #239 | Tragic 11.7% |
| Immigrants | Immigrants | 2.7 /100 | #240 | Tragic 11.7% |
| Eastern Europeans | 2.7 /100 | #241 | Tragic 11.7% |
| Turks | 2.6 /100 | #242 | Tragic 11.7% |
| Cheyenne | 2.4 /100 | #243 | Tragic 11.7% |
| Immigrants | Portugal | 2.2 /100 | #244 | Tragic 11.7% |
| Immigrants | Honduras | 2.1 /100 | #245 | Tragic 11.8% |
| Menominee | 2.0 /100 | #246 | Tragic 11.8% |
| Immigrants | Czechoslovakia | 2.0 /100 | #247 | Tragic 11.8% |
| Immigrants | Belgium | 1.9 /100 | #248 | Tragic 11.8% |
| Immigrants | Nigeria | 1.9 /100 | #249 | Tragic 11.8% |
| Paiute | 1.8 /100 | #250 | Tragic 11.8% |