Lebanese vs Haitian Median Male Earnings
COMPARE
Lebanese
Haitian
Median Male Earnings
Median Male Earnings Comparison
Lebanese
Haitians
$57,409
MEDIAN MALE EARNINGS
94.6/ 100
METRIC RATING
116th/ 347
METRIC RANK
$45,903
MEDIAN MALE EARNINGS
0.0/ 100
METRIC RATING
319th/ 347
METRIC RANK
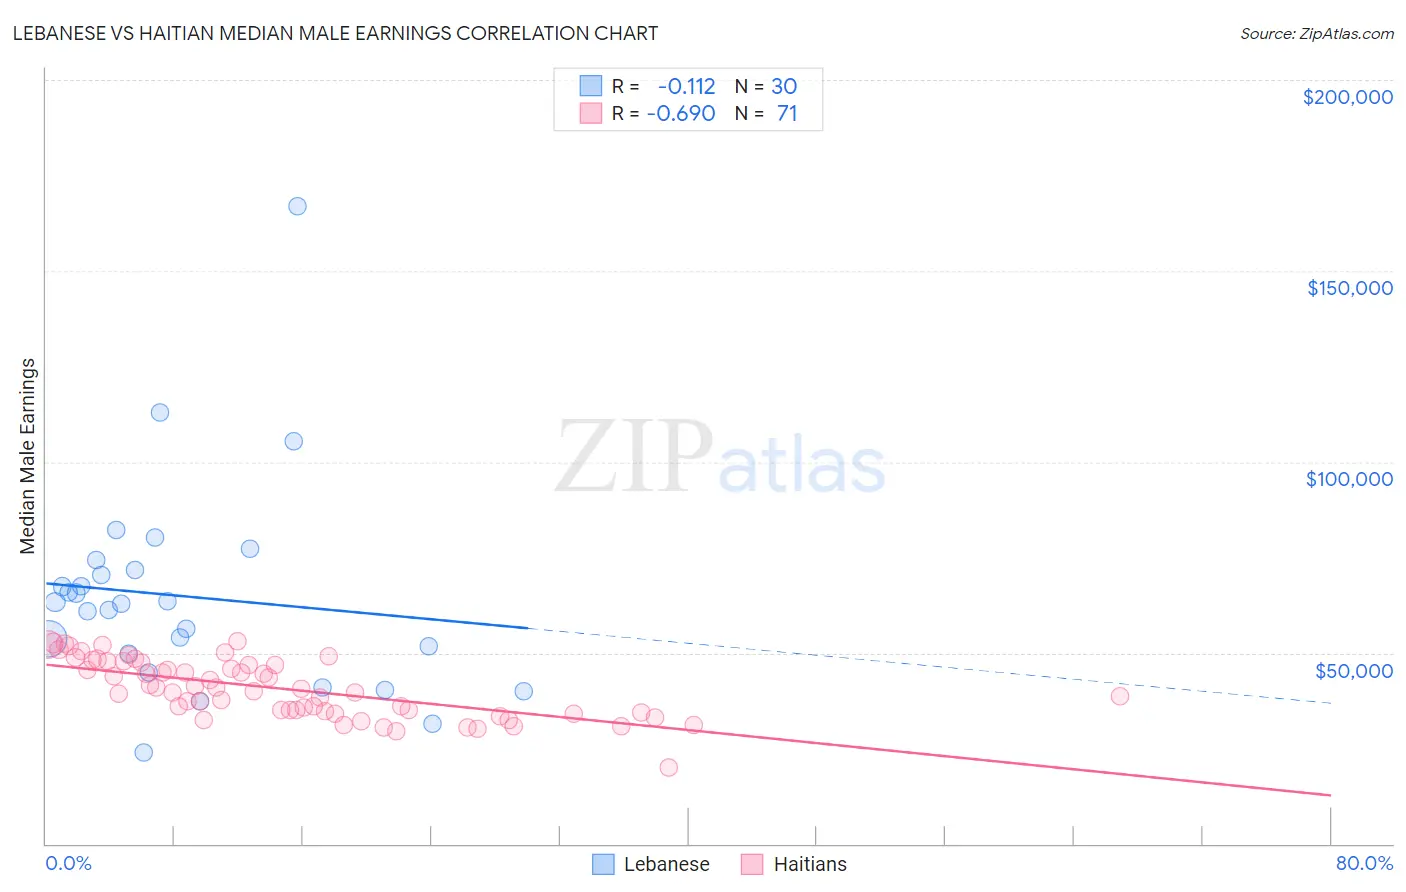
Lebanese vs Haitian Median Male Earnings Correlation Chart
The statistical analysis conducted on geographies consisting of 401,493,865 people shows a poor negative correlation between the proportion of Lebanese and median male earnings in the United States with a correlation coefficient (R) of -0.112 and weighted average of $57,409. Similarly, the statistical analysis conducted on geographies consisting of 287,952,359 people shows a significant negative correlation between the proportion of Haitians and median male earnings in the United States with a correlation coefficient (R) of -0.690 and weighted average of $45,903, a difference of 25.1%.
Median Male Earnings Correlation Summary
| Measurement | Lebanese | Haitian |
| Minimum | $23,959 | $19,963 |
| Maximum | $167,014 | $53,128 |
| Range | $143,055 | $33,165 |
| Mean | $64,779 | $40,657 |
| Median | $62,976 | $40,467 |
| Interquartile 25% (IQ1) | $49,621 | $34,672 |
| Interquartile 75% (IQ3) | $71,843 | $47,602 |
| Interquartile Range (IQR) | $22,221 | $12,930 |
| Standard Deviation (Sample) | $27,382 | $7,455 |
| Standard Deviation (Population) | $26,922 | $7,403 |
Similar Demographics by Median Male Earnings
Demographics Similar to Lebanese by Median Male Earnings
In terms of median male earnings, the demographic groups most similar to Lebanese are Swedish ($57,445, a difference of 0.060%), Immigrants from Zimbabwe ($57,352, a difference of 0.10%), Hungarian ($57,309, a difference of 0.18%), Arab ($57,298, a difference of 0.19%), and Canadian ($57,286, a difference of 0.22%).
| Demographics | Rating | Rank | Median Male Earnings |
| British | 96.5 /100 | #109 | Exceptional $57,890 |
| Palestinians | 96.2 /100 | #110 | Exceptional $57,778 |
| Europeans | 95.6 /100 | #111 | Exceptional $57,637 |
| Immigrants | Afghanistan | 95.4 /100 | #112 | Exceptional $57,582 |
| Carpatho Rusyns | 95.3 /100 | #113 | Exceptional $57,572 |
| Immigrants | Kuwait | 95.3 /100 | #114 | Exceptional $57,562 |
| Swedes | 94.8 /100 | #115 | Exceptional $57,445 |
| Lebanese | 94.6 /100 | #116 | Exceptional $57,409 |
| Immigrants | Zimbabwe | 94.3 /100 | #117 | Exceptional $57,352 |
| Hungarians | 94.0 /100 | #118 | Exceptional $57,309 |
| Arabs | 94.0 /100 | #119 | Exceptional $57,298 |
| Canadians | 93.9 /100 | #120 | Exceptional $57,286 |
| Immigrants | Albania | 93.3 /100 | #121 | Exceptional $57,179 |
| Immigrants | Jordan | 93.1 /100 | #122 | Exceptional $57,145 |
| Slovenes | 93.1 /100 | #123 | Exceptional $57,145 |
Demographics Similar to Haitians by Median Male Earnings
In terms of median male earnings, the demographic groups most similar to Haitians are Immigrants from Honduras ($45,787, a difference of 0.25%), Cheyenne ($46,062, a difference of 0.35%), Mexican ($46,147, a difference of 0.53%), Immigrants from Caribbean ($46,193, a difference of 0.63%), and Fijian ($45,607, a difference of 0.65%).
| Demographics | Rating | Rank | Median Male Earnings |
| Hispanics or Latinos | 0.0 /100 | #312 | Tragic $46,419 |
| Hondurans | 0.0 /100 | #313 | Tragic $46,374 |
| Chippewa | 0.0 /100 | #314 | Tragic $46,368 |
| Immigrants | Guatemala | 0.0 /100 | #315 | Tragic $46,244 |
| Immigrants | Caribbean | 0.0 /100 | #316 | Tragic $46,193 |
| Mexicans | 0.0 /100 | #317 | Tragic $46,147 |
| Cheyenne | 0.0 /100 | #318 | Tragic $46,062 |
| Haitians | 0.0 /100 | #319 | Tragic $45,903 |
| Immigrants | Honduras | 0.0 /100 | #320 | Tragic $45,787 |
| Fijians | 0.0 /100 | #321 | Tragic $45,607 |
| Sioux | 0.0 /100 | #322 | Tragic $45,566 |
| Immigrants | Central America | 0.0 /100 | #323 | Tragic $45,538 |
| Blacks/African Americans | 0.0 /100 | #324 | Tragic $45,523 |
| Yuman | 0.0 /100 | #325 | Tragic $45,446 |
| Immigrants | Haiti | 0.0 /100 | #326 | Tragic $45,266 |