Immigrants from Uzbekistan vs Haitian Median Male Earnings
COMPARE
Immigrants from Uzbekistan
Haitian
Median Male Earnings
Median Male Earnings Comparison
Immigrants from Uzbekistan
Haitians
$57,941
MEDIAN MALE EARNINGS
96.7/ 100
METRIC RATING
108th/ 347
METRIC RANK
$45,903
MEDIAN MALE EARNINGS
0.0/ 100
METRIC RATING
319th/ 347
METRIC RANK
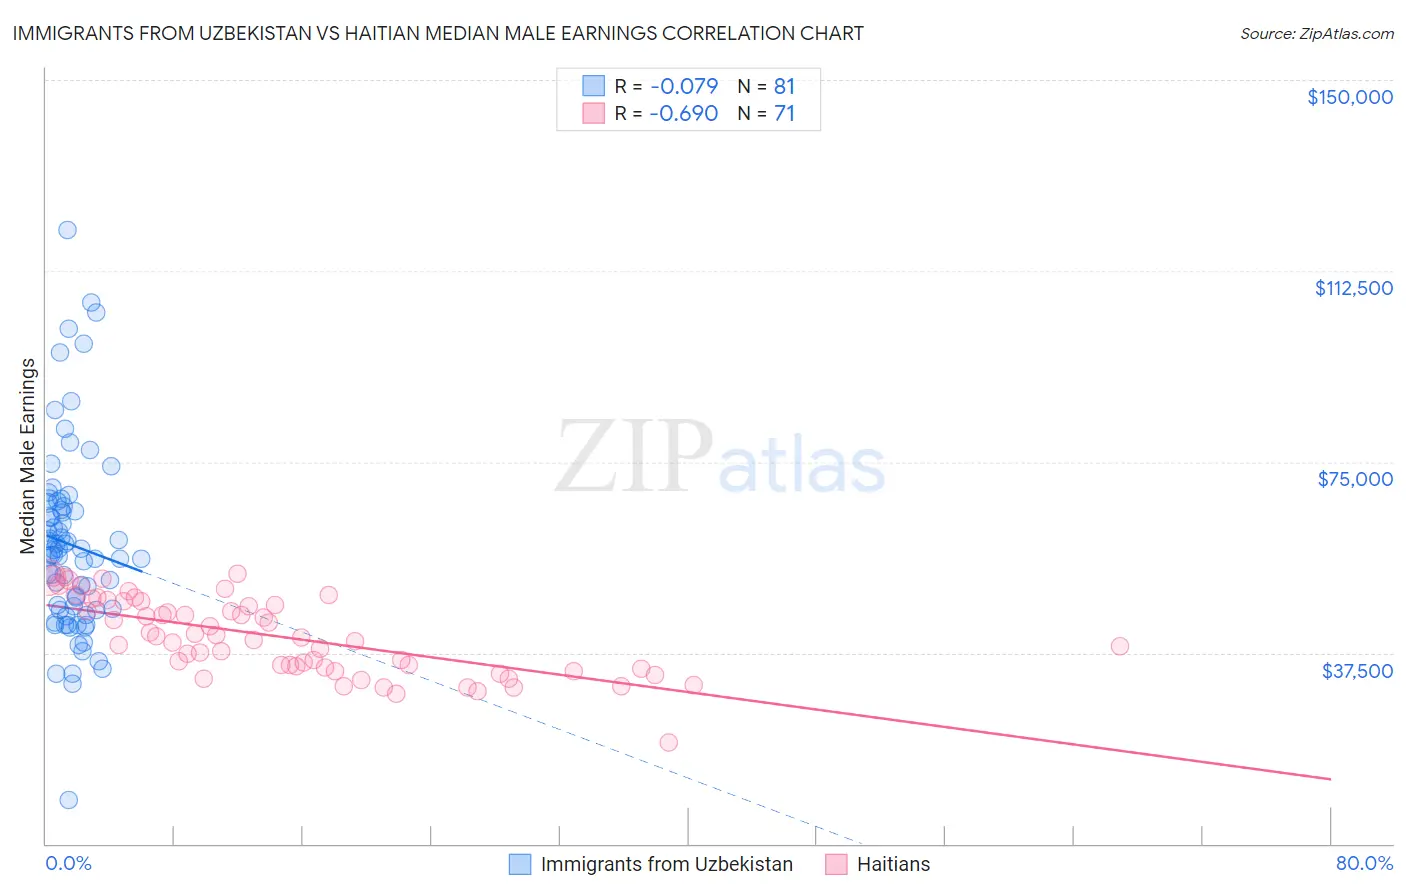
Immigrants from Uzbekistan vs Haitian Median Male Earnings Correlation Chart
The statistical analysis conducted on geographies consisting of 118,770,599 people shows a slight negative correlation between the proportion of Immigrants from Uzbekistan and median male earnings in the United States with a correlation coefficient (R) of -0.079 and weighted average of $57,941. Similarly, the statistical analysis conducted on geographies consisting of 287,952,359 people shows a significant negative correlation between the proportion of Haitians and median male earnings in the United States with a correlation coefficient (R) of -0.690 and weighted average of $45,903, a difference of 26.2%.
Median Male Earnings Correlation Summary
| Measurement | Immigrants from Uzbekistan | Haitian |
| Minimum | $8,518 | $19,963 |
| Maximum | $120,441 | $53,128 |
| Range | $111,923 | $33,165 |
| Mean | $58,740 | $40,657 |
| Median | $56,668 | $40,467 |
| Interquartile 25% (IQ1) | $45,939 | $34,672 |
| Interquartile 75% (IQ3) | $66,644 | $47,602 |
| Interquartile Range (IQR) | $20,705 | $12,930 |
| Standard Deviation (Sample) | $18,622 | $7,455 |
| Standard Deviation (Population) | $18,506 | $7,403 |
Similar Demographics by Median Male Earnings
Demographics Similar to Immigrants from Uzbekistan by Median Male Earnings
In terms of median male earnings, the demographic groups most similar to Immigrants from Uzbekistan are Serbian ($57,975, a difference of 0.060%), British ($57,890, a difference of 0.090%), Immigrants from Northern Africa ($58,008, a difference of 0.12%), Palestinian ($57,778, a difference of 0.28%), and Armenian ($58,134, a difference of 0.33%).
| Demographics | Rating | Rank | Median Male Earnings |
| Immigrants | Brazil | 97.7 /100 | #101 | Exceptional $58,324 |
| Syrians | 97.4 /100 | #102 | Exceptional $58,187 |
| Poles | 97.3 /100 | #103 | Exceptional $58,139 |
| Armenians | 97.3 /100 | #104 | Exceptional $58,134 |
| Immigrants | Western Asia | 97.3 /100 | #105 | Exceptional $58,131 |
| Immigrants | Northern Africa | 96.9 /100 | #106 | Exceptional $58,008 |
| Serbians | 96.8 /100 | #107 | Exceptional $57,975 |
| Immigrants | Uzbekistan | 96.7 /100 | #108 | Exceptional $57,941 |
| British | 96.5 /100 | #109 | Exceptional $57,890 |
| Palestinians | 96.2 /100 | #110 | Exceptional $57,778 |
| Europeans | 95.6 /100 | #111 | Exceptional $57,637 |
| Immigrants | Afghanistan | 95.4 /100 | #112 | Exceptional $57,582 |
| Carpatho Rusyns | 95.3 /100 | #113 | Exceptional $57,572 |
| Immigrants | Kuwait | 95.3 /100 | #114 | Exceptional $57,562 |
| Swedes | 94.8 /100 | #115 | Exceptional $57,445 |
Demographics Similar to Haitians by Median Male Earnings
In terms of median male earnings, the demographic groups most similar to Haitians are Immigrants from Honduras ($45,787, a difference of 0.25%), Cheyenne ($46,062, a difference of 0.35%), Mexican ($46,147, a difference of 0.53%), Immigrants from Caribbean ($46,193, a difference of 0.63%), and Fijian ($45,607, a difference of 0.65%).
| Demographics | Rating | Rank | Median Male Earnings |
| Hispanics or Latinos | 0.0 /100 | #312 | Tragic $46,419 |
| Hondurans | 0.0 /100 | #313 | Tragic $46,374 |
| Chippewa | 0.0 /100 | #314 | Tragic $46,368 |
| Immigrants | Guatemala | 0.0 /100 | #315 | Tragic $46,244 |
| Immigrants | Caribbean | 0.0 /100 | #316 | Tragic $46,193 |
| Mexicans | 0.0 /100 | #317 | Tragic $46,147 |
| Cheyenne | 0.0 /100 | #318 | Tragic $46,062 |
| Haitians | 0.0 /100 | #319 | Tragic $45,903 |
| Immigrants | Honduras | 0.0 /100 | #320 | Tragic $45,787 |
| Fijians | 0.0 /100 | #321 | Tragic $45,607 |
| Sioux | 0.0 /100 | #322 | Tragic $45,566 |
| Immigrants | Central America | 0.0 /100 | #323 | Tragic $45,538 |
| Blacks/African Americans | 0.0 /100 | #324 | Tragic $45,523 |
| Yuman | 0.0 /100 | #325 | Tragic $45,446 |
| Immigrants | Haiti | 0.0 /100 | #326 | Tragic $45,266 |