Lebanese vs Immigrants from Denmark Median Male Earnings
COMPARE
Lebanese
Immigrants from Denmark
Median Male Earnings
Median Male Earnings Comparison
Lebanese
Immigrants from Denmark
$57,409
MEDIAN MALE EARNINGS
94.6/ 100
METRIC RATING
116th/ 347
METRIC RANK
$64,625
MEDIAN MALE EARNINGS
100.0/ 100
METRIC RATING
25th/ 347
METRIC RANK
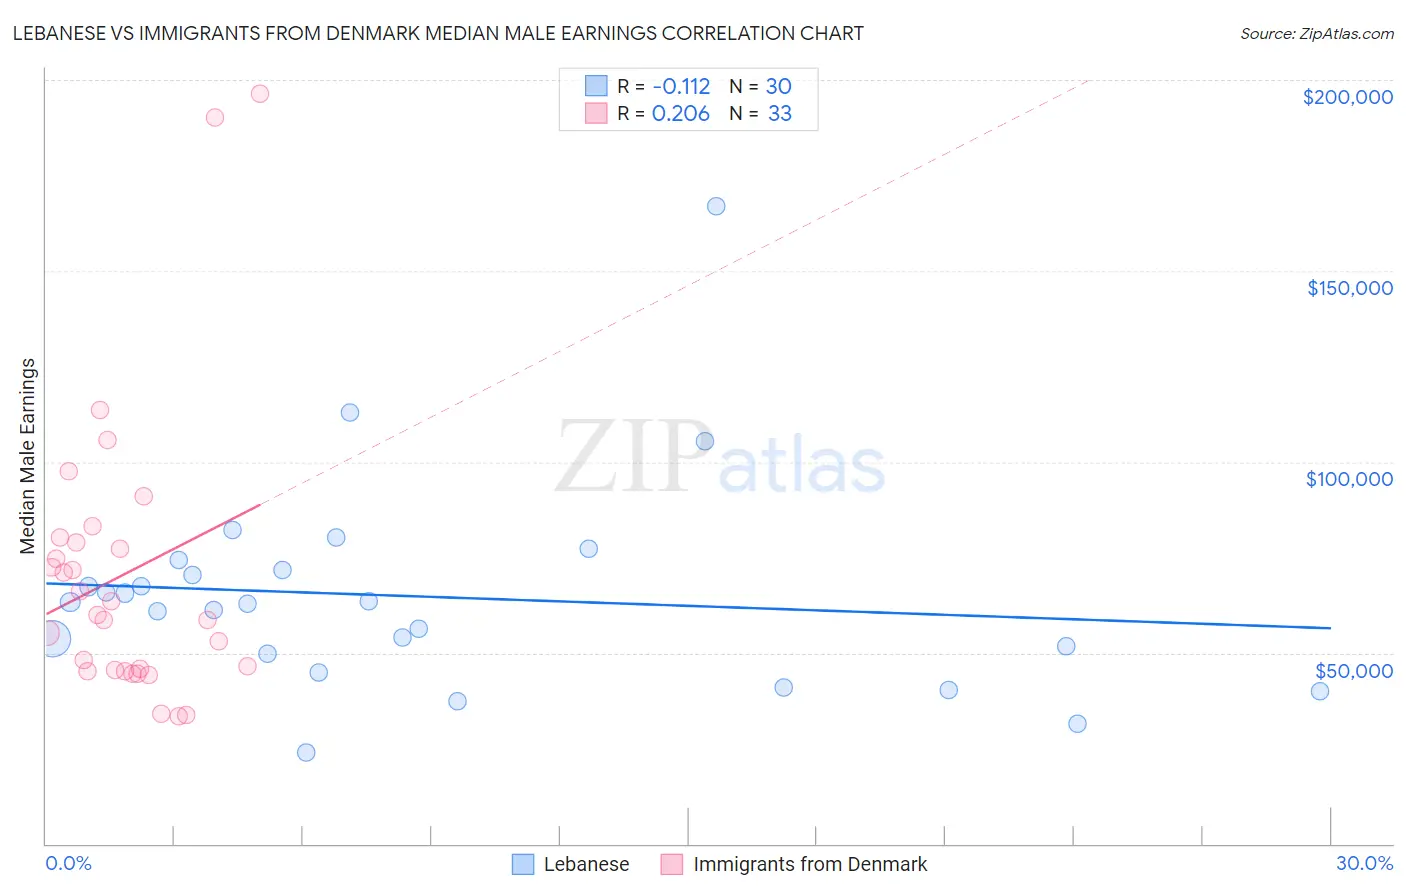
Lebanese vs Immigrants from Denmark Median Male Earnings Correlation Chart
The statistical analysis conducted on geographies consisting of 401,493,865 people shows a poor negative correlation between the proportion of Lebanese and median male earnings in the United States with a correlation coefficient (R) of -0.112 and weighted average of $57,409. Similarly, the statistical analysis conducted on geographies consisting of 136,409,110 people shows a weak positive correlation between the proportion of Immigrants from Denmark and median male earnings in the United States with a correlation coefficient (R) of 0.206 and weighted average of $64,625, a difference of 12.6%.
Median Male Earnings Correlation Summary
| Measurement | Lebanese | Immigrants from Denmark |
| Minimum | $23,959 | $33,446 |
| Maximum | $167,014 | $196,250 |
| Range | $143,055 | $162,804 |
| Mean | $64,779 | $70,566 |
| Median | $62,976 | $59,978 |
| Interquartile 25% (IQ1) | $49,621 | $45,341 |
| Interquartile 75% (IQ3) | $71,843 | $79,588 |
| Interquartile Range (IQR) | $22,221 | $34,248 |
| Standard Deviation (Sample) | $27,382 | $37,718 |
| Standard Deviation (Population) | $26,922 | $37,142 |
Similar Demographics by Median Male Earnings
Demographics Similar to Lebanese by Median Male Earnings
In terms of median male earnings, the demographic groups most similar to Lebanese are Swedish ($57,445, a difference of 0.060%), Immigrants from Zimbabwe ($57,352, a difference of 0.10%), Hungarian ($57,309, a difference of 0.18%), Arab ($57,298, a difference of 0.19%), and Canadian ($57,286, a difference of 0.22%).
| Demographics | Rating | Rank | Median Male Earnings |
| British | 96.5 /100 | #109 | Exceptional $57,890 |
| Palestinians | 96.2 /100 | #110 | Exceptional $57,778 |
| Europeans | 95.6 /100 | #111 | Exceptional $57,637 |
| Immigrants | Afghanistan | 95.4 /100 | #112 | Exceptional $57,582 |
| Carpatho Rusyns | 95.3 /100 | #113 | Exceptional $57,572 |
| Immigrants | Kuwait | 95.3 /100 | #114 | Exceptional $57,562 |
| Swedes | 94.8 /100 | #115 | Exceptional $57,445 |
| Lebanese | 94.6 /100 | #116 | Exceptional $57,409 |
| Immigrants | Zimbabwe | 94.3 /100 | #117 | Exceptional $57,352 |
| Hungarians | 94.0 /100 | #118 | Exceptional $57,309 |
| Arabs | 94.0 /100 | #119 | Exceptional $57,298 |
| Canadians | 93.9 /100 | #120 | Exceptional $57,286 |
| Immigrants | Albania | 93.3 /100 | #121 | Exceptional $57,179 |
| Immigrants | Jordan | 93.1 /100 | #122 | Exceptional $57,145 |
| Slovenes | 93.1 /100 | #123 | Exceptional $57,145 |
Demographics Similar to Immigrants from Denmark by Median Male Earnings
In terms of median male earnings, the demographic groups most similar to Immigrants from Denmark are Immigrants from Northern Europe ($64,987, a difference of 0.56%), Turkish ($64,253, a difference of 0.58%), Immigrants from Korea ($65,079, a difference of 0.70%), Burmese ($65,236, a difference of 0.95%), and Immigrants from Switzerland ($63,944, a difference of 1.1%).
| Demographics | Rating | Rank | Median Male Earnings |
| Indians (Asian) | 100.0 /100 | #18 | Exceptional $66,078 |
| Cypriots | 100.0 /100 | #19 | Exceptional $65,549 |
| Immigrants | Japan | 100.0 /100 | #20 | Exceptional $65,518 |
| Immigrants | Sweden | 100.0 /100 | #21 | Exceptional $65,406 |
| Burmese | 100.0 /100 | #22 | Exceptional $65,236 |
| Immigrants | Korea | 100.0 /100 | #23 | Exceptional $65,079 |
| Immigrants | Northern Europe | 100.0 /100 | #24 | Exceptional $64,987 |
| Immigrants | Denmark | 100.0 /100 | #25 | Exceptional $64,625 |
| Turks | 100.0 /100 | #26 | Exceptional $64,253 |
| Immigrants | Switzerland | 100.0 /100 | #27 | Exceptional $63,944 |
| Russians | 100.0 /100 | #28 | Exceptional $63,939 |
| Asians | 100.0 /100 | #29 | Exceptional $63,827 |
| Immigrants | France | 100.0 /100 | #30 | Exceptional $63,715 |
| Latvians | 100.0 /100 | #31 | Exceptional $63,498 |
| Soviet Union | 100.0 /100 | #32 | Exceptional $63,382 |