Immigrants from Morocco vs Haitian Median Male Earnings
COMPARE
Immigrants from Morocco
Haitian
Median Male Earnings
Median Male Earnings Comparison
Immigrants from Morocco
Haitians
$56,958
MEDIAN MALE EARNINGS
91.8/ 100
METRIC RATING
125th/ 347
METRIC RANK
$45,903
MEDIAN MALE EARNINGS
0.0/ 100
METRIC RATING
319th/ 347
METRIC RANK
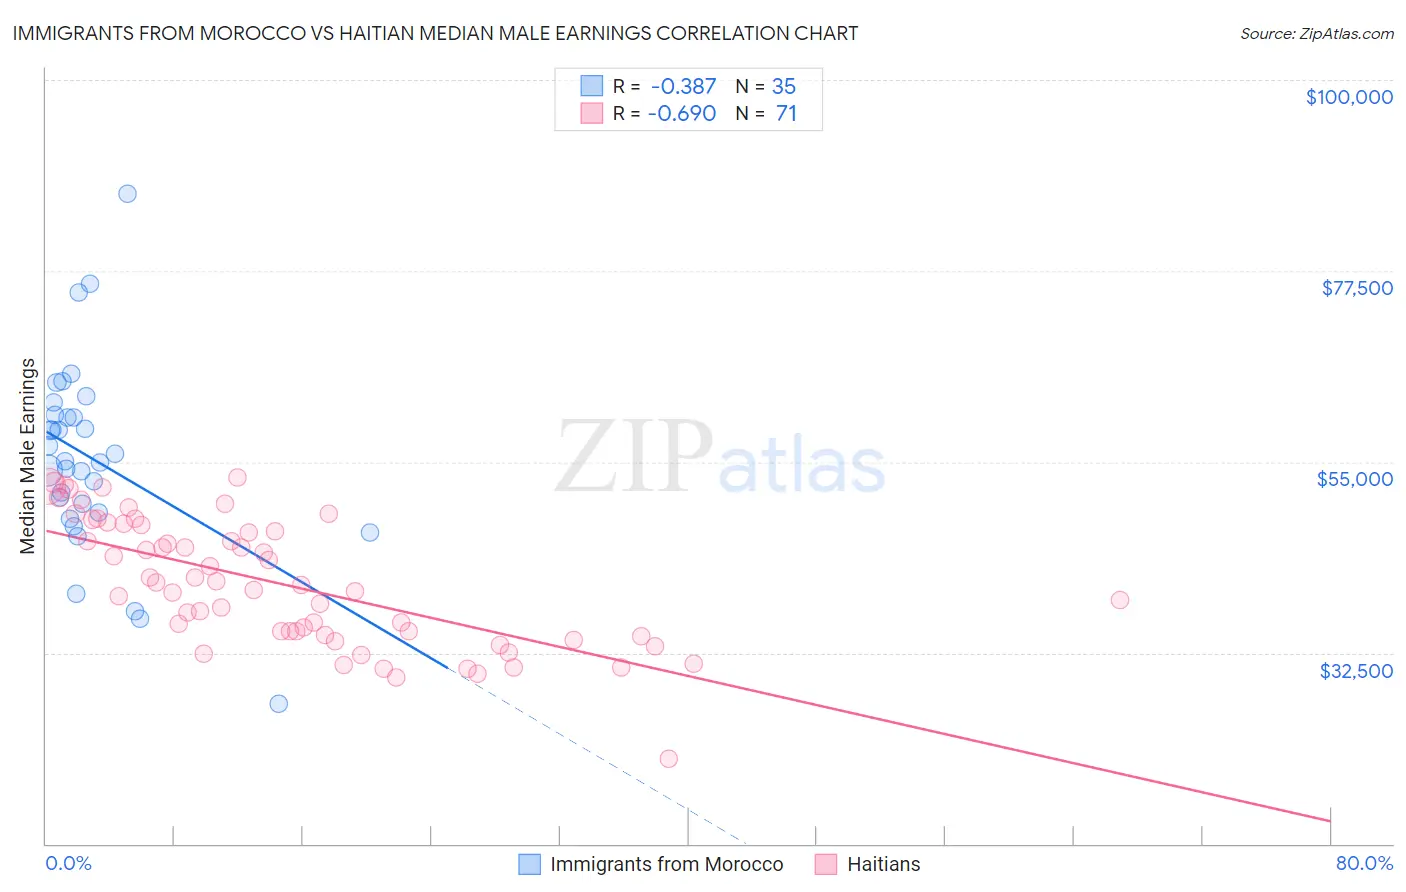
Immigrants from Morocco vs Haitian Median Male Earnings Correlation Chart
The statistical analysis conducted on geographies consisting of 178,898,918 people shows a mild negative correlation between the proportion of Immigrants from Morocco and median male earnings in the United States with a correlation coefficient (R) of -0.387 and weighted average of $56,958. Similarly, the statistical analysis conducted on geographies consisting of 287,952,359 people shows a significant negative correlation between the proportion of Haitians and median male earnings in the United States with a correlation coefficient (R) of -0.690 and weighted average of $45,903, a difference of 24.1%.
Median Male Earnings Correlation Summary
| Measurement | Immigrants from Morocco | Haitian |
| Minimum | $26,429 | $19,963 |
| Maximum | $86,602 | $53,128 |
| Range | $60,173 | $33,165 |
| Mean | $55,429 | $40,657 |
| Median | $55,129 | $40,467 |
| Interquartile 25% (IQ1) | $49,000 | $34,672 |
| Interquartile 75% (IQ3) | $60,575 | $47,602 |
| Interquartile Range (IQR) | $11,575 | $12,930 |
| Standard Deviation (Sample) | $11,412 | $7,455 |
| Standard Deviation (Population) | $11,248 | $7,403 |
Similar Demographics by Median Male Earnings
Demographics Similar to Immigrants from Morocco by Median Male Earnings
In terms of median male earnings, the demographic groups most similar to Immigrants from Morocco are Chilean ($56,973, a difference of 0.030%), Chinese ($56,872, a difference of 0.15%), Brazilian ($56,837, a difference of 0.21%), Immigrants from Syria ($56,830, a difference of 0.23%), and Immigrants from Jordan ($57,145, a difference of 0.33%).
| Demographics | Rating | Rank | Median Male Earnings |
| Hungarians | 94.0 /100 | #118 | Exceptional $57,309 |
| Arabs | 94.0 /100 | #119 | Exceptional $57,298 |
| Canadians | 93.9 /100 | #120 | Exceptional $57,286 |
| Immigrants | Albania | 93.3 /100 | #121 | Exceptional $57,179 |
| Immigrants | Jordan | 93.1 /100 | #122 | Exceptional $57,145 |
| Slovenes | 93.1 /100 | #123 | Exceptional $57,145 |
| Chileans | 91.9 /100 | #124 | Exceptional $56,973 |
| Immigrants | Morocco | 91.8 /100 | #125 | Exceptional $56,958 |
| Chinese | 91.1 /100 | #126 | Exceptional $56,872 |
| Brazilians | 90.9 /100 | #127 | Exceptional $56,837 |
| Immigrants | Syria | 90.8 /100 | #128 | Exceptional $56,830 |
| Pakistanis | 89.9 /100 | #129 | Excellent $56,719 |
| Koreans | 89.4 /100 | #130 | Excellent $56,672 |
| Portuguese | 89.4 /100 | #131 | Excellent $56,663 |
| Czechs | 88.2 /100 | #132 | Excellent $56,546 |
Demographics Similar to Haitians by Median Male Earnings
In terms of median male earnings, the demographic groups most similar to Haitians are Immigrants from Honduras ($45,787, a difference of 0.25%), Cheyenne ($46,062, a difference of 0.35%), Mexican ($46,147, a difference of 0.53%), Immigrants from Caribbean ($46,193, a difference of 0.63%), and Fijian ($45,607, a difference of 0.65%).
| Demographics | Rating | Rank | Median Male Earnings |
| Hispanics or Latinos | 0.0 /100 | #312 | Tragic $46,419 |
| Hondurans | 0.0 /100 | #313 | Tragic $46,374 |
| Chippewa | 0.0 /100 | #314 | Tragic $46,368 |
| Immigrants | Guatemala | 0.0 /100 | #315 | Tragic $46,244 |
| Immigrants | Caribbean | 0.0 /100 | #316 | Tragic $46,193 |
| Mexicans | 0.0 /100 | #317 | Tragic $46,147 |
| Cheyenne | 0.0 /100 | #318 | Tragic $46,062 |
| Haitians | 0.0 /100 | #319 | Tragic $45,903 |
| Immigrants | Honduras | 0.0 /100 | #320 | Tragic $45,787 |
| Fijians | 0.0 /100 | #321 | Tragic $45,607 |
| Sioux | 0.0 /100 | #322 | Tragic $45,566 |
| Immigrants | Central America | 0.0 /100 | #323 | Tragic $45,538 |
| Blacks/African Americans | 0.0 /100 | #324 | Tragic $45,523 |
| Yuman | 0.0 /100 | #325 | Tragic $45,446 |
| Immigrants | Haiti | 0.0 /100 | #326 | Tragic $45,266 |