Immigrants from Norway vs Haitian Median Male Earnings
COMPARE
Immigrants from Norway
Haitian
Median Male Earnings
Median Male Earnings Comparison
Immigrants from Norway
Haitians
$61,628
MEDIAN MALE EARNINGS
99.9/ 100
METRIC RATING
52nd/ 347
METRIC RANK
$45,903
MEDIAN MALE EARNINGS
0.0/ 100
METRIC RATING
319th/ 347
METRIC RANK
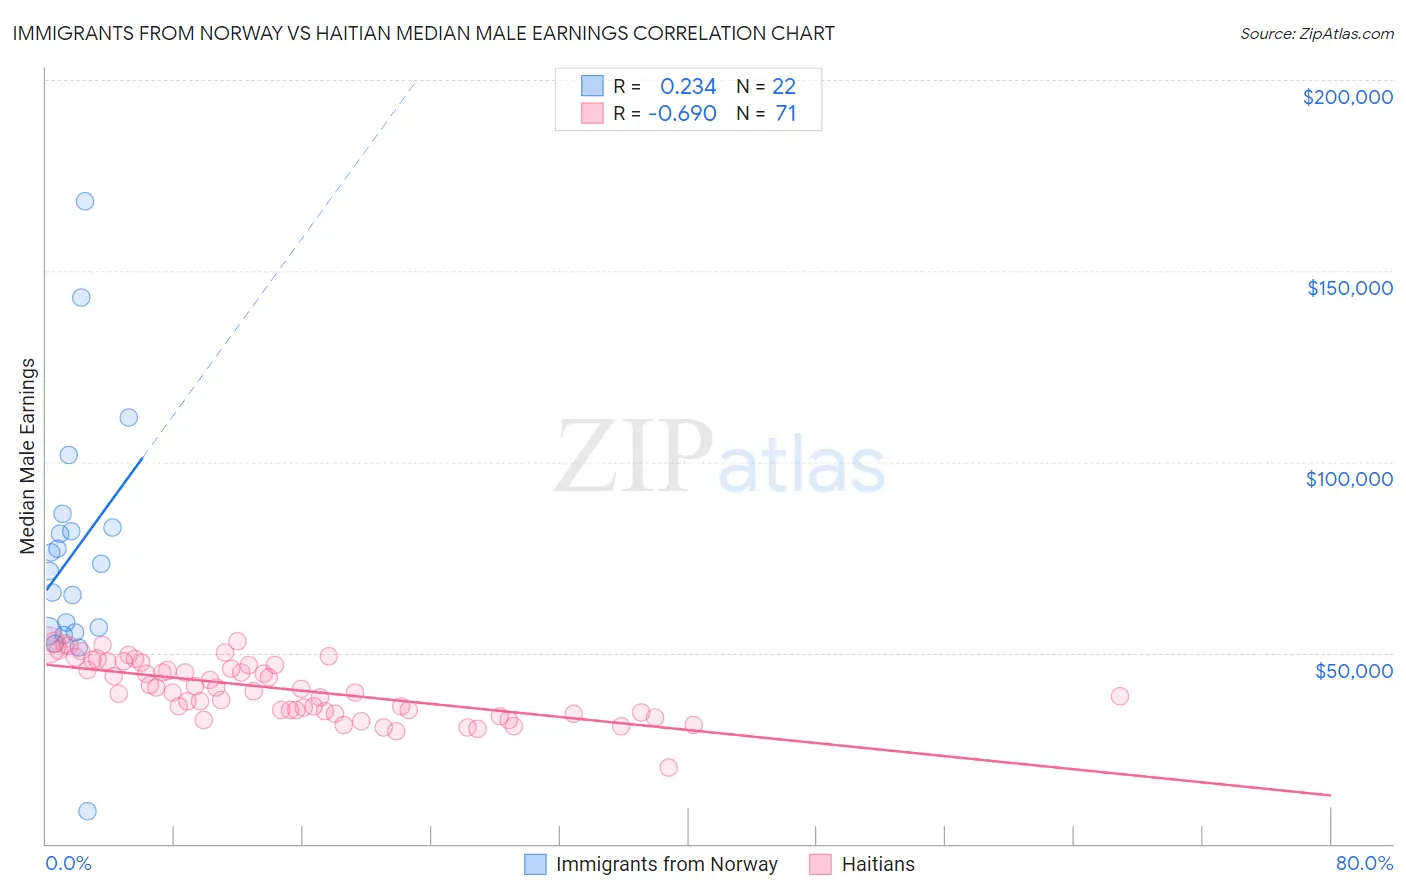
Immigrants from Norway vs Haitian Median Male Earnings Correlation Chart
The statistical analysis conducted on geographies consisting of 116,702,945 people shows a weak positive correlation between the proportion of Immigrants from Norway and median male earnings in the United States with a correlation coefficient (R) of 0.234 and weighted average of $61,628. Similarly, the statistical analysis conducted on geographies consisting of 287,952,359 people shows a significant negative correlation between the proportion of Haitians and median male earnings in the United States with a correlation coefficient (R) of -0.690 and weighted average of $45,903, a difference of 34.3%.
Median Male Earnings Correlation Summary
| Measurement | Immigrants from Norway | Haitian |
| Minimum | $8,547 | $19,963 |
| Maximum | $168,268 | $53,128 |
| Range | $159,721 | $33,165 |
| Mean | $76,311 | $40,657 |
| Median | $72,426 | $40,467 |
| Interquartile 25% (IQ1) | $55,593 | $34,672 |
| Interquartile 75% (IQ3) | $82,963 | $47,602 |
| Interquartile Range (IQR) | $27,370 | $12,930 |
| Standard Deviation (Sample) | $33,202 | $7,455 |
| Standard Deviation (Population) | $32,439 | $7,403 |
Similar Demographics by Median Male Earnings
Demographics Similar to Immigrants from Norway by Median Male Earnings
In terms of median male earnings, the demographic groups most similar to Immigrants from Norway are Estonian ($61,710, a difference of 0.13%), Bhutanese ($61,759, a difference of 0.21%), South African ($61,460, a difference of 0.27%), Immigrants from Latvia ($61,422, a difference of 0.34%), and Greek ($61,242, a difference of 0.63%).
| Demographics | Rating | Rank | Median Male Earnings |
| Bulgarians | 100.0 /100 | #45 | Exceptional $62,378 |
| Immigrants | Czechoslovakia | 99.9 /100 | #46 | Exceptional $62,217 |
| Immigrants | Austria | 99.9 /100 | #47 | Exceptional $62,164 |
| Immigrants | Malaysia | 99.9 /100 | #48 | Exceptional $62,121 |
| Immigrants | Europe | 99.9 /100 | #49 | Exceptional $62,057 |
| Bhutanese | 99.9 /100 | #50 | Exceptional $61,759 |
| Estonians | 99.9 /100 | #51 | Exceptional $61,710 |
| Immigrants | Norway | 99.9 /100 | #52 | Exceptional $61,628 |
| South Africans | 99.9 /100 | #53 | Exceptional $61,460 |
| Immigrants | Latvia | 99.9 /100 | #54 | Exceptional $61,422 |
| Greeks | 99.9 /100 | #55 | Exceptional $61,242 |
| Lithuanians | 99.9 /100 | #56 | Exceptional $61,228 |
| Immigrants | Scotland | 99.9 /100 | #57 | Exceptional $61,220 |
| New Zealanders | 99.9 /100 | #58 | Exceptional $61,199 |
| Immigrants | Netherlands | 99.8 /100 | #59 | Exceptional $61,096 |
Demographics Similar to Haitians by Median Male Earnings
In terms of median male earnings, the demographic groups most similar to Haitians are Immigrants from Honduras ($45,787, a difference of 0.25%), Cheyenne ($46,062, a difference of 0.35%), Mexican ($46,147, a difference of 0.53%), Immigrants from Caribbean ($46,193, a difference of 0.63%), and Fijian ($45,607, a difference of 0.65%).
| Demographics | Rating | Rank | Median Male Earnings |
| Hispanics or Latinos | 0.0 /100 | #312 | Tragic $46,419 |
| Hondurans | 0.0 /100 | #313 | Tragic $46,374 |
| Chippewa | 0.0 /100 | #314 | Tragic $46,368 |
| Immigrants | Guatemala | 0.0 /100 | #315 | Tragic $46,244 |
| Immigrants | Caribbean | 0.0 /100 | #316 | Tragic $46,193 |
| Mexicans | 0.0 /100 | #317 | Tragic $46,147 |
| Cheyenne | 0.0 /100 | #318 | Tragic $46,062 |
| Haitians | 0.0 /100 | #319 | Tragic $45,903 |
| Immigrants | Honduras | 0.0 /100 | #320 | Tragic $45,787 |
| Fijians | 0.0 /100 | #321 | Tragic $45,607 |
| Sioux | 0.0 /100 | #322 | Tragic $45,566 |
| Immigrants | Central America | 0.0 /100 | #323 | Tragic $45,538 |
| Blacks/African Americans | 0.0 /100 | #324 | Tragic $45,523 |
| Yuman | 0.0 /100 | #325 | Tragic $45,446 |
| Immigrants | Haiti | 0.0 /100 | #326 | Tragic $45,266 |