Lebanese vs Icelander Median Male Earnings
COMPARE
Lebanese
Icelander
Median Male Earnings
Median Male Earnings Comparison
Lebanese
Icelanders
$57,409
MEDIAN MALE EARNINGS
94.6/ 100
METRIC RATING
116th/ 347
METRIC RANK
$55,415
MEDIAN MALE EARNINGS
71.2/ 100
METRIC RATING
157th/ 347
METRIC RANK
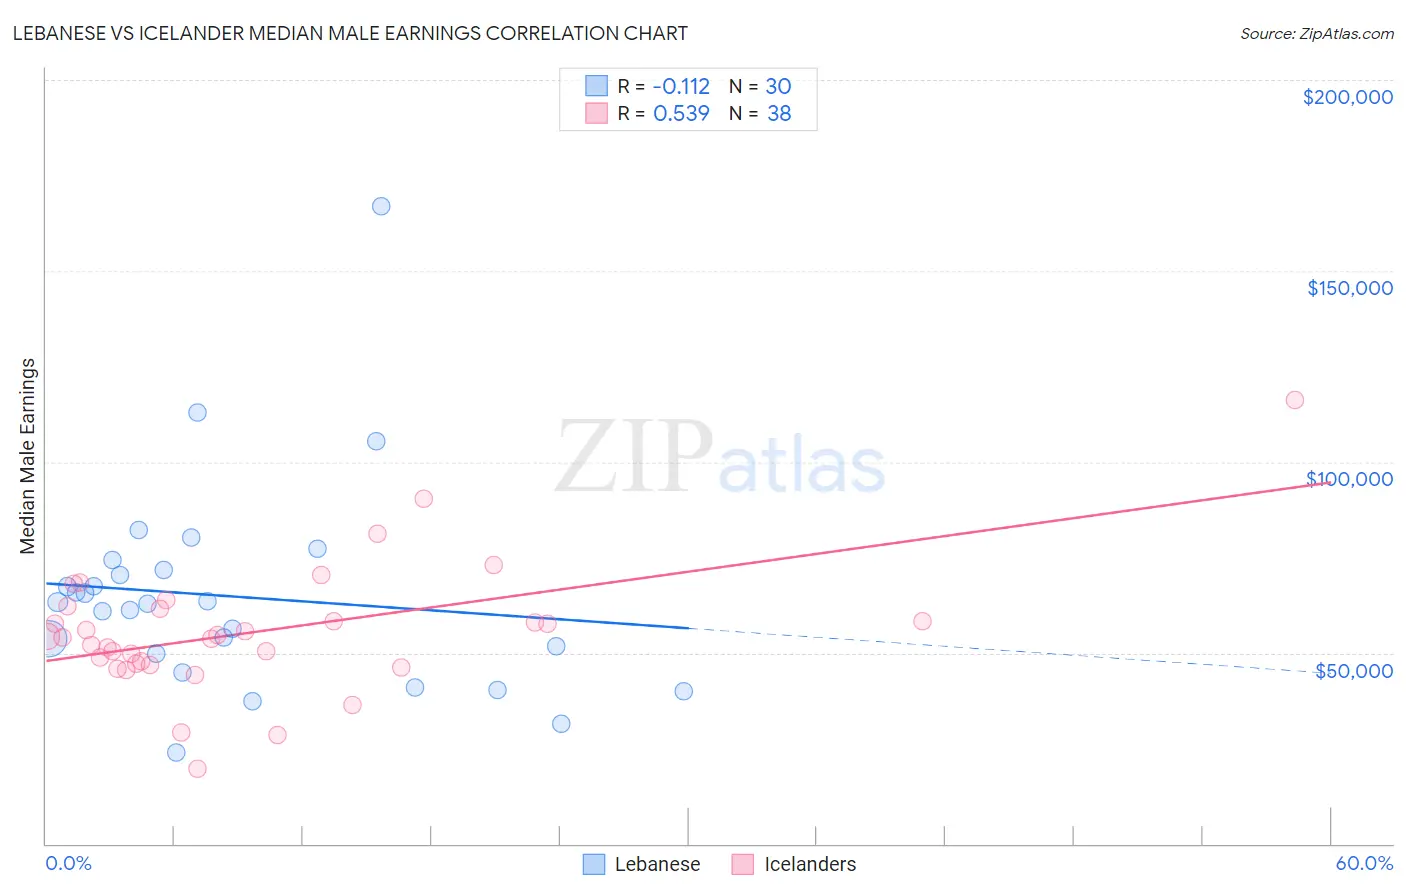
Lebanese vs Icelander Median Male Earnings Correlation Chart
The statistical analysis conducted on geographies consisting of 401,493,865 people shows a poor negative correlation between the proportion of Lebanese and median male earnings in the United States with a correlation coefficient (R) of -0.112 and weighted average of $57,409. Similarly, the statistical analysis conducted on geographies consisting of 159,653,287 people shows a substantial positive correlation between the proportion of Icelanders and median male earnings in the United States with a correlation coefficient (R) of 0.539 and weighted average of $55,415, a difference of 3.6%.
Median Male Earnings Correlation Summary
| Measurement | Lebanese | Icelander |
| Minimum | $23,959 | $19,583 |
| Maximum | $167,014 | $116,188 |
| Range | $143,055 | $96,605 |
| Mean | $64,779 | $55,596 |
| Median | $62,976 | $54,221 |
| Interquartile 25% (IQ1) | $49,621 | $47,034 |
| Interquartile 75% (IQ3) | $71,843 | $61,435 |
| Interquartile Range (IQR) | $22,221 | $14,401 |
| Standard Deviation (Sample) | $27,382 | $16,814 |
| Standard Deviation (Population) | $26,922 | $16,591 |
Similar Demographics by Median Male Earnings
Demographics Similar to Lebanese by Median Male Earnings
In terms of median male earnings, the demographic groups most similar to Lebanese are Swedish ($57,445, a difference of 0.060%), Immigrants from Zimbabwe ($57,352, a difference of 0.10%), Hungarian ($57,309, a difference of 0.18%), Arab ($57,298, a difference of 0.19%), and Canadian ($57,286, a difference of 0.22%).
| Demographics | Rating | Rank | Median Male Earnings |
| British | 96.5 /100 | #109 | Exceptional $57,890 |
| Palestinians | 96.2 /100 | #110 | Exceptional $57,778 |
| Europeans | 95.6 /100 | #111 | Exceptional $57,637 |
| Immigrants | Afghanistan | 95.4 /100 | #112 | Exceptional $57,582 |
| Carpatho Rusyns | 95.3 /100 | #113 | Exceptional $57,572 |
| Immigrants | Kuwait | 95.3 /100 | #114 | Exceptional $57,562 |
| Swedes | 94.8 /100 | #115 | Exceptional $57,445 |
| Lebanese | 94.6 /100 | #116 | Exceptional $57,409 |
| Immigrants | Zimbabwe | 94.3 /100 | #117 | Exceptional $57,352 |
| Hungarians | 94.0 /100 | #118 | Exceptional $57,309 |
| Arabs | 94.0 /100 | #119 | Exceptional $57,298 |
| Canadians | 93.9 /100 | #120 | Exceptional $57,286 |
| Immigrants | Albania | 93.3 /100 | #121 | Exceptional $57,179 |
| Immigrants | Jordan | 93.1 /100 | #122 | Exceptional $57,145 |
| Slovenes | 93.1 /100 | #123 | Exceptional $57,145 |
Demographics Similar to Icelanders by Median Male Earnings
In terms of median male earnings, the demographic groups most similar to Icelanders are Immigrants from Ethiopia ($55,434, a difference of 0.030%), Czechoslovakian ($55,382, a difference of 0.060%), Alsatian ($55,380, a difference of 0.060%), Basque ($55,370, a difference of 0.080%), and Belgian ($55,361, a difference of 0.10%).
| Demographics | Rating | Rank | Median Male Earnings |
| Swiss | 77.1 /100 | #150 | Good $55,731 |
| Immigrants | Oceania | 76.8 /100 | #151 | Good $55,712 |
| Peruvians | 75.8 /100 | #152 | Good $55,659 |
| Immigrants | Nepal | 75.0 /100 | #153 | Good $55,615 |
| Taiwanese | 73.9 /100 | #154 | Good $55,556 |
| Scandinavians | 73.4 /100 | #155 | Good $55,527 |
| Immigrants | Ethiopia | 71.6 /100 | #156 | Good $55,434 |
| Icelanders | 71.2 /100 | #157 | Good $55,415 |
| Czechoslovakians | 70.5 /100 | #158 | Good $55,382 |
| Alsatians | 70.5 /100 | #159 | Good $55,380 |
| Basques | 70.3 /100 | #160 | Good $55,370 |
| Belgians | 70.1 /100 | #161 | Good $55,361 |
| French | 69.9 /100 | #162 | Good $55,350 |
| Ugandans | 68.6 /100 | #163 | Good $55,290 |
| Immigrants | South Eastern Asia | 67.6 /100 | #164 | Good $55,241 |