Lebanese vs Iraqi Median Male Earnings
COMPARE
Lebanese
Iraqi
Median Male Earnings
Median Male Earnings Comparison
Lebanese
Iraqis
$57,409
MEDIAN MALE EARNINGS
94.6/ 100
METRIC RATING
116th/ 347
METRIC RANK
$54,182
MEDIAN MALE EARNINGS
42.5/ 100
METRIC RATING
180th/ 347
METRIC RANK
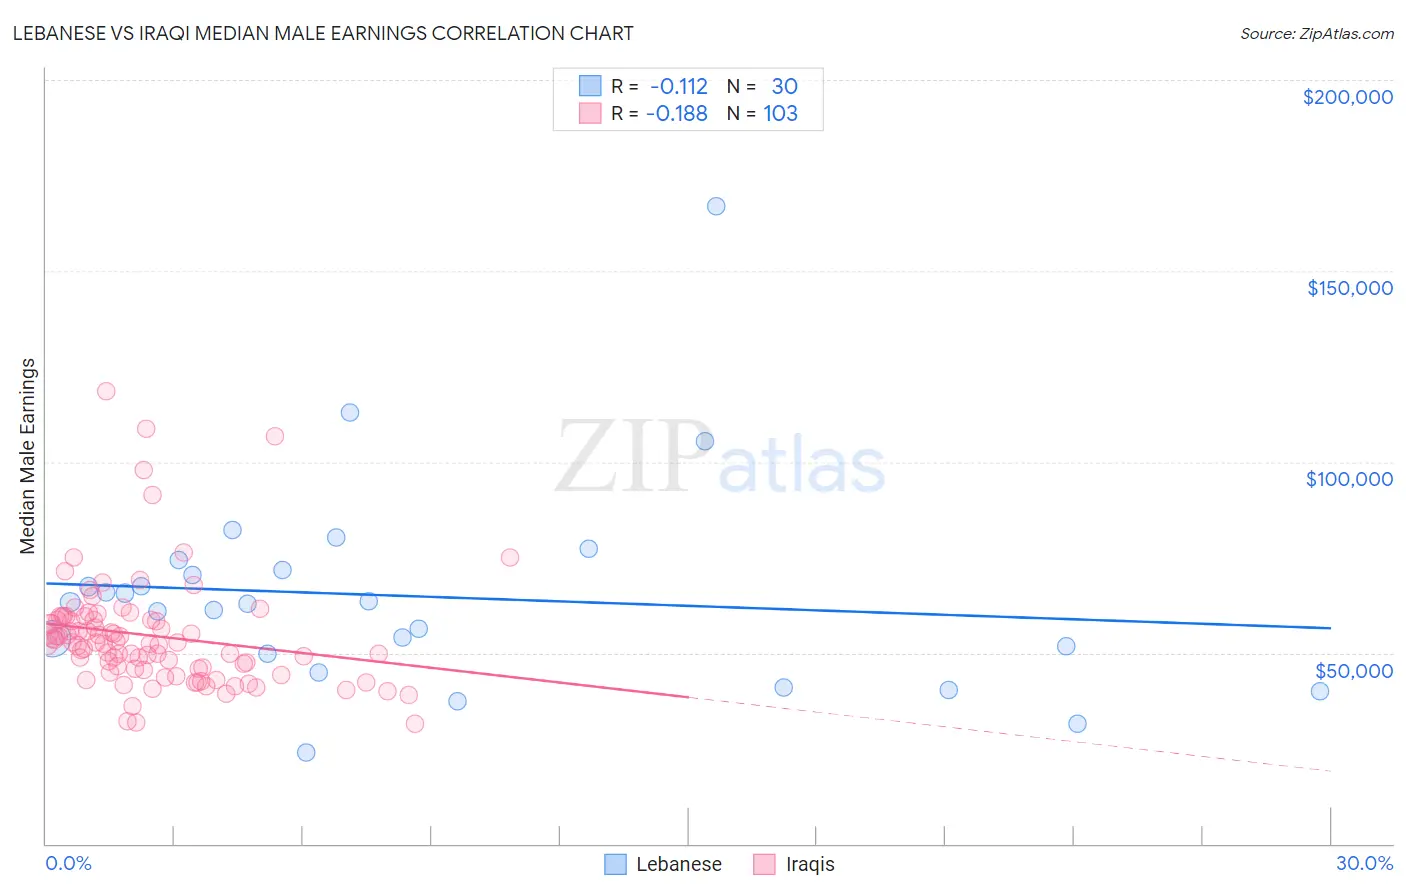
Lebanese vs Iraqi Median Male Earnings Correlation Chart
The statistical analysis conducted on geographies consisting of 401,493,865 people shows a poor negative correlation between the proportion of Lebanese and median male earnings in the United States with a correlation coefficient (R) of -0.112 and weighted average of $57,409. Similarly, the statistical analysis conducted on geographies consisting of 170,629,617 people shows a poor negative correlation between the proportion of Iraqis and median male earnings in the United States with a correlation coefficient (R) of -0.188 and weighted average of $54,182, a difference of 6.0%.
Median Male Earnings Correlation Summary
| Measurement | Lebanese | Iraqi |
| Minimum | $23,959 | $31,325 |
| Maximum | $167,014 | $118,495 |
| Range | $143,055 | $87,170 |
| Mean | $64,779 | $54,518 |
| Median | $62,976 | $52,559 |
| Interquartile 25% (IQ1) | $49,621 | $45,816 |
| Interquartile 75% (IQ3) | $71,843 | $58,664 |
| Interquartile Range (IQR) | $22,221 | $12,848 |
| Standard Deviation (Sample) | $27,382 | $14,678 |
| Standard Deviation (Population) | $26,922 | $14,607 |
Similar Demographics by Median Male Earnings
Demographics Similar to Lebanese by Median Male Earnings
In terms of median male earnings, the demographic groups most similar to Lebanese are Swedish ($57,445, a difference of 0.060%), Immigrants from Zimbabwe ($57,352, a difference of 0.10%), Hungarian ($57,309, a difference of 0.18%), Arab ($57,298, a difference of 0.19%), and Canadian ($57,286, a difference of 0.22%).
| Demographics | Rating | Rank | Median Male Earnings |
| British | 96.5 /100 | #109 | Exceptional $57,890 |
| Palestinians | 96.2 /100 | #110 | Exceptional $57,778 |
| Europeans | 95.6 /100 | #111 | Exceptional $57,637 |
| Immigrants | Afghanistan | 95.4 /100 | #112 | Exceptional $57,582 |
| Carpatho Rusyns | 95.3 /100 | #113 | Exceptional $57,572 |
| Immigrants | Kuwait | 95.3 /100 | #114 | Exceptional $57,562 |
| Swedes | 94.8 /100 | #115 | Exceptional $57,445 |
| Lebanese | 94.6 /100 | #116 | Exceptional $57,409 |
| Immigrants | Zimbabwe | 94.3 /100 | #117 | Exceptional $57,352 |
| Hungarians | 94.0 /100 | #118 | Exceptional $57,309 |
| Arabs | 94.0 /100 | #119 | Exceptional $57,298 |
| Canadians | 93.9 /100 | #120 | Exceptional $57,286 |
| Immigrants | Albania | 93.3 /100 | #121 | Exceptional $57,179 |
| Immigrants | Jordan | 93.1 /100 | #122 | Exceptional $57,145 |
| Slovenes | 93.1 /100 | #123 | Exceptional $57,145 |
Demographics Similar to Iraqis by Median Male Earnings
In terms of median male earnings, the demographic groups most similar to Iraqis are Immigrants ($54,168, a difference of 0.030%), Celtic ($54,242, a difference of 0.11%), Costa Rican ($54,279, a difference of 0.18%), Sierra Leonean ($54,279, a difference of 0.18%), and Spaniard ($54,401, a difference of 0.40%).
| Demographics | Rating | Rank | Median Male Earnings |
| South American Indians | 50.4 /100 | #173 | Average $54,508 |
| South Americans | 50.0 /100 | #174 | Average $54,492 |
| Dutch | 48.0 /100 | #175 | Average $54,410 |
| Spaniards | 47.8 /100 | #176 | Average $54,401 |
| Costa Ricans | 44.8 /100 | #177 | Average $54,279 |
| Sierra Leoneans | 44.8 /100 | #178 | Average $54,279 |
| Celtics | 43.9 /100 | #179 | Average $54,242 |
| Iraqis | 42.5 /100 | #180 | Average $54,182 |
| Immigrants | Immigrants | 42.1 /100 | #181 | Average $54,168 |
| Yugoslavians | 37.4 /100 | #182 | Fair $53,967 |
| Immigrants | South America | 37.3 /100 | #183 | Fair $53,962 |
| Whites/Caucasians | 36.5 /100 | #184 | Fair $53,925 |
| Immigrants | Sierra Leone | 36.0 /100 | #185 | Fair $53,905 |
| Colombians | 34.4 /100 | #186 | Fair $53,832 |
| Immigrants | Eritrea | 31.8 /100 | #187 | Fair $53,715 |