Ukrainian vs Haitian Median Male Earnings
COMPARE
Ukrainian
Haitian
Median Male Earnings
Median Male Earnings Comparison
Ukrainians
Haitians
$59,728
MEDIAN MALE EARNINGS
99.4/ 100
METRIC RATING
81st/ 347
METRIC RANK
$45,903
MEDIAN MALE EARNINGS
0.0/ 100
METRIC RATING
319th/ 347
METRIC RANK
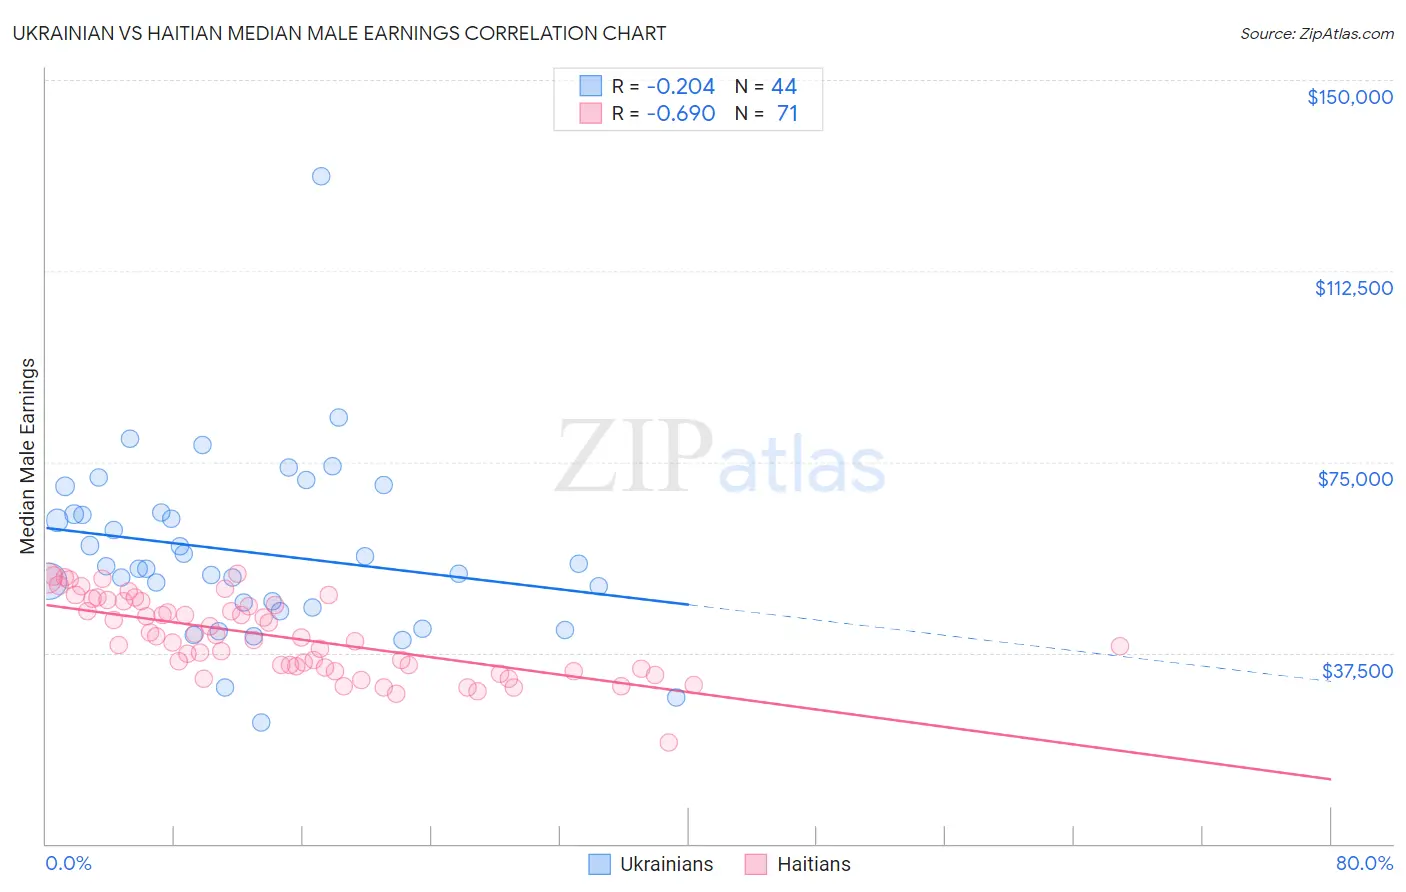
Ukrainian vs Haitian Median Male Earnings Correlation Chart
The statistical analysis conducted on geographies consisting of 448,432,137 people shows a weak negative correlation between the proportion of Ukrainians and median male earnings in the United States with a correlation coefficient (R) of -0.204 and weighted average of $59,728. Similarly, the statistical analysis conducted on geographies consisting of 287,952,359 people shows a significant negative correlation between the proportion of Haitians and median male earnings in the United States with a correlation coefficient (R) of -0.690 and weighted average of $45,903, a difference of 30.1%.
Median Male Earnings Correlation Summary
| Measurement | Ukrainian | Haitian |
| Minimum | $23,696 | $19,963 |
| Maximum | $131,091 | $53,128 |
| Range | $107,394 | $33,165 |
| Mean | $57,214 | $40,657 |
| Median | $54,259 | $40,467 |
| Interquartile 25% (IQ1) | $46,850 | $34,672 |
| Interquartile 75% (IQ3) | $64,861 | $47,602 |
| Interquartile Range (IQR) | $18,011 | $12,930 |
| Standard Deviation (Sample) | $17,751 | $7,455 |
| Standard Deviation (Population) | $17,548 | $7,403 |
Similar Demographics by Median Male Earnings
Demographics Similar to Ukrainians by Median Male Earnings
In terms of median male earnings, the demographic groups most similar to Ukrainians are Croatian ($59,715, a difference of 0.020%), Immigrants from Italy ($59,691, a difference of 0.060%), Immigrants from Hungary ($59,806, a difference of 0.13%), Immigrants from Ukraine ($59,820, a difference of 0.16%), and Afghan ($59,554, a difference of 0.29%).
| Demographics | Rating | Rank | Median Male Earnings |
| Argentineans | 99.6 /100 | #74 | Exceptional $60,117 |
| Immigrants | Bolivia | 99.6 /100 | #75 | Exceptional $60,088 |
| Romanians | 99.6 /100 | #76 | Exceptional $60,063 |
| Paraguayans | 99.5 /100 | #77 | Exceptional $59,975 |
| Immigrants | Egypt | 99.5 /100 | #78 | Exceptional $59,925 |
| Immigrants | Ukraine | 99.5 /100 | #79 | Exceptional $59,820 |
| Immigrants | Hungary | 99.5 /100 | #80 | Exceptional $59,806 |
| Ukrainians | 99.4 /100 | #81 | Exceptional $59,728 |
| Croatians | 99.4 /100 | #82 | Exceptional $59,715 |
| Immigrants | Italy | 99.4 /100 | #83 | Exceptional $59,691 |
| Afghans | 99.3 /100 | #84 | Exceptional $59,554 |
| Italians | 99.3 /100 | #85 | Exceptional $59,551 |
| Immigrants | England | 99.3 /100 | #86 | Exceptional $59,527 |
| Macedonians | 99.3 /100 | #87 | Exceptional $59,522 |
| Immigrants | Argentina | 99.3 /100 | #88 | Exceptional $59,491 |
Demographics Similar to Haitians by Median Male Earnings
In terms of median male earnings, the demographic groups most similar to Haitians are Immigrants from Honduras ($45,787, a difference of 0.25%), Cheyenne ($46,062, a difference of 0.35%), Mexican ($46,147, a difference of 0.53%), Immigrants from Caribbean ($46,193, a difference of 0.63%), and Fijian ($45,607, a difference of 0.65%).
| Demographics | Rating | Rank | Median Male Earnings |
| Hispanics or Latinos | 0.0 /100 | #312 | Tragic $46,419 |
| Hondurans | 0.0 /100 | #313 | Tragic $46,374 |
| Chippewa | 0.0 /100 | #314 | Tragic $46,368 |
| Immigrants | Guatemala | 0.0 /100 | #315 | Tragic $46,244 |
| Immigrants | Caribbean | 0.0 /100 | #316 | Tragic $46,193 |
| Mexicans | 0.0 /100 | #317 | Tragic $46,147 |
| Cheyenne | 0.0 /100 | #318 | Tragic $46,062 |
| Haitians | 0.0 /100 | #319 | Tragic $45,903 |
| Immigrants | Honduras | 0.0 /100 | #320 | Tragic $45,787 |
| Fijians | 0.0 /100 | #321 | Tragic $45,607 |
| Sioux | 0.0 /100 | #322 | Tragic $45,566 |
| Immigrants | Central America | 0.0 /100 | #323 | Tragic $45,538 |
| Blacks/African Americans | 0.0 /100 | #324 | Tragic $45,523 |
| Yuman | 0.0 /100 | #325 | Tragic $45,446 |
| Immigrants | Haiti | 0.0 /100 | #326 | Tragic $45,266 |