Lebanese vs Israeli Median Male Earnings
COMPARE
Lebanese
Israeli
Median Male Earnings
Median Male Earnings Comparison
Lebanese
Israelis
$57,409
MEDIAN MALE EARNINGS
94.6/ 100
METRIC RATING
116th/ 347
METRIC RANK
$63,228
MEDIAN MALE EARNINGS
100.0/ 100
METRIC RATING
36th/ 347
METRIC RANK
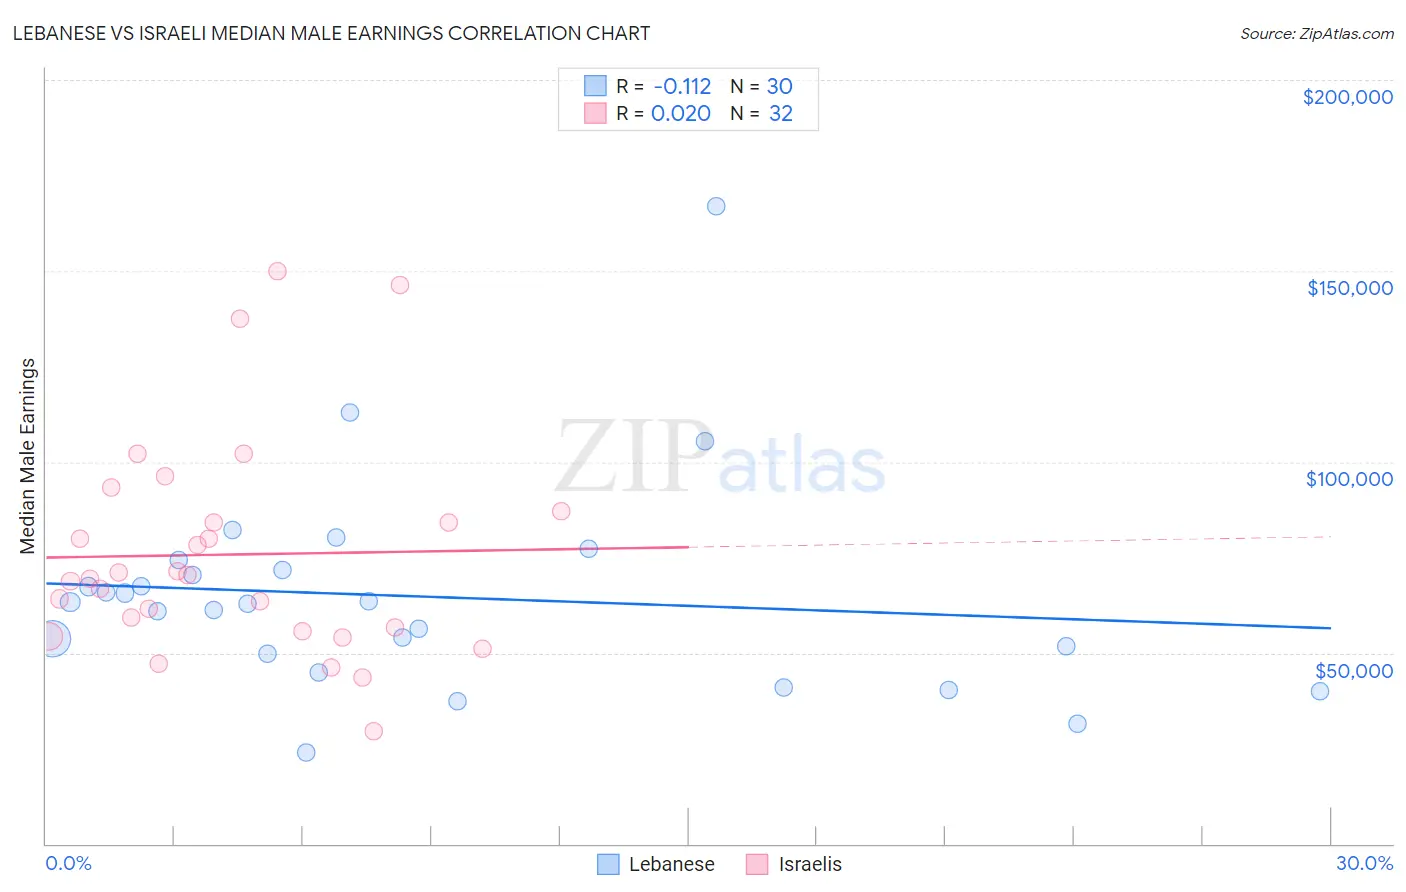
Lebanese vs Israeli Median Male Earnings Correlation Chart
The statistical analysis conducted on geographies consisting of 401,493,865 people shows a poor negative correlation between the proportion of Lebanese and median male earnings in the United States with a correlation coefficient (R) of -0.112 and weighted average of $57,409. Similarly, the statistical analysis conducted on geographies consisting of 211,181,462 people shows no correlation between the proportion of Israelis and median male earnings in the United States with a correlation coefficient (R) of 0.020 and weighted average of $63,228, a difference of 10.1%.
Median Male Earnings Correlation Summary
| Measurement | Lebanese | Israeli |
| Minimum | $23,959 | $29,375 |
| Maximum | $167,014 | $149,778 |
| Range | $143,055 | $120,403 |
| Mean | $64,779 | $75,746 |
| Median | $62,976 | $69,912 |
| Interquartile 25% (IQ1) | $49,621 | $56,213 |
| Interquartile 75% (IQ3) | $71,843 | $85,475 |
| Interquartile Range (IQR) | $22,221 | $29,262 |
| Standard Deviation (Sample) | $27,382 | $28,326 |
| Standard Deviation (Population) | $26,922 | $27,880 |
Similar Demographics by Median Male Earnings
Demographics Similar to Lebanese by Median Male Earnings
In terms of median male earnings, the demographic groups most similar to Lebanese are Swedish ($57,445, a difference of 0.060%), Immigrants from Zimbabwe ($57,352, a difference of 0.10%), Hungarian ($57,309, a difference of 0.18%), Arab ($57,298, a difference of 0.19%), and Canadian ($57,286, a difference of 0.22%).
| Demographics | Rating | Rank | Median Male Earnings |
| British | 96.5 /100 | #109 | Exceptional $57,890 |
| Palestinians | 96.2 /100 | #110 | Exceptional $57,778 |
| Europeans | 95.6 /100 | #111 | Exceptional $57,637 |
| Immigrants | Afghanistan | 95.4 /100 | #112 | Exceptional $57,582 |
| Carpatho Rusyns | 95.3 /100 | #113 | Exceptional $57,572 |
| Immigrants | Kuwait | 95.3 /100 | #114 | Exceptional $57,562 |
| Swedes | 94.8 /100 | #115 | Exceptional $57,445 |
| Lebanese | 94.6 /100 | #116 | Exceptional $57,409 |
| Immigrants | Zimbabwe | 94.3 /100 | #117 | Exceptional $57,352 |
| Hungarians | 94.0 /100 | #118 | Exceptional $57,309 |
| Arabs | 94.0 /100 | #119 | Exceptional $57,298 |
| Canadians | 93.9 /100 | #120 | Exceptional $57,286 |
| Immigrants | Albania | 93.3 /100 | #121 | Exceptional $57,179 |
| Immigrants | Jordan | 93.1 /100 | #122 | Exceptional $57,145 |
| Slovenes | 93.1 /100 | #123 | Exceptional $57,145 |
Demographics Similar to Israelis by Median Male Earnings
In terms of median male earnings, the demographic groups most similar to Israelis are Immigrants from Asia ($63,240, a difference of 0.020%), Immigrants from Russia ($63,326, a difference of 0.16%), Immigrants from Lithuania ($63,346, a difference of 0.19%), Immigrants from Sri Lanka ($63,099, a difference of 0.20%), and Soviet Union ($63,382, a difference of 0.24%).
| Demographics | Rating | Rank | Median Male Earnings |
| Asians | 100.0 /100 | #29 | Exceptional $63,827 |
| Immigrants | France | 100.0 /100 | #30 | Exceptional $63,715 |
| Latvians | 100.0 /100 | #31 | Exceptional $63,498 |
| Soviet Union | 100.0 /100 | #32 | Exceptional $63,382 |
| Immigrants | Lithuania | 100.0 /100 | #33 | Exceptional $63,346 |
| Immigrants | Russia | 100.0 /100 | #34 | Exceptional $63,326 |
| Immigrants | Asia | 100.0 /100 | #35 | Exceptional $63,240 |
| Israelis | 100.0 /100 | #36 | Exceptional $63,228 |
| Immigrants | Sri Lanka | 100.0 /100 | #37 | Exceptional $63,099 |
| Maltese | 100.0 /100 | #38 | Exceptional $62,953 |
| Immigrants | South Africa | 100.0 /100 | #39 | Exceptional $62,899 |
| Australians | 100.0 /100 | #40 | Exceptional $62,857 |
| Immigrants | Turkey | 100.0 /100 | #41 | Exceptional $62,728 |
| Immigrants | Greece | 100.0 /100 | #42 | Exceptional $62,689 |
| Immigrants | Belarus | 100.0 /100 | #43 | Exceptional $62,658 |