Lebanese vs Immigrants from Malaysia Median Male Earnings
COMPARE
Lebanese
Immigrants from Malaysia
Median Male Earnings
Median Male Earnings Comparison
Lebanese
Immigrants from Malaysia
$57,409
MEDIAN MALE EARNINGS
94.6/ 100
METRIC RATING
116th/ 347
METRIC RANK
$62,121
MEDIAN MALE EARNINGS
99.9/ 100
METRIC RATING
48th/ 347
METRIC RANK
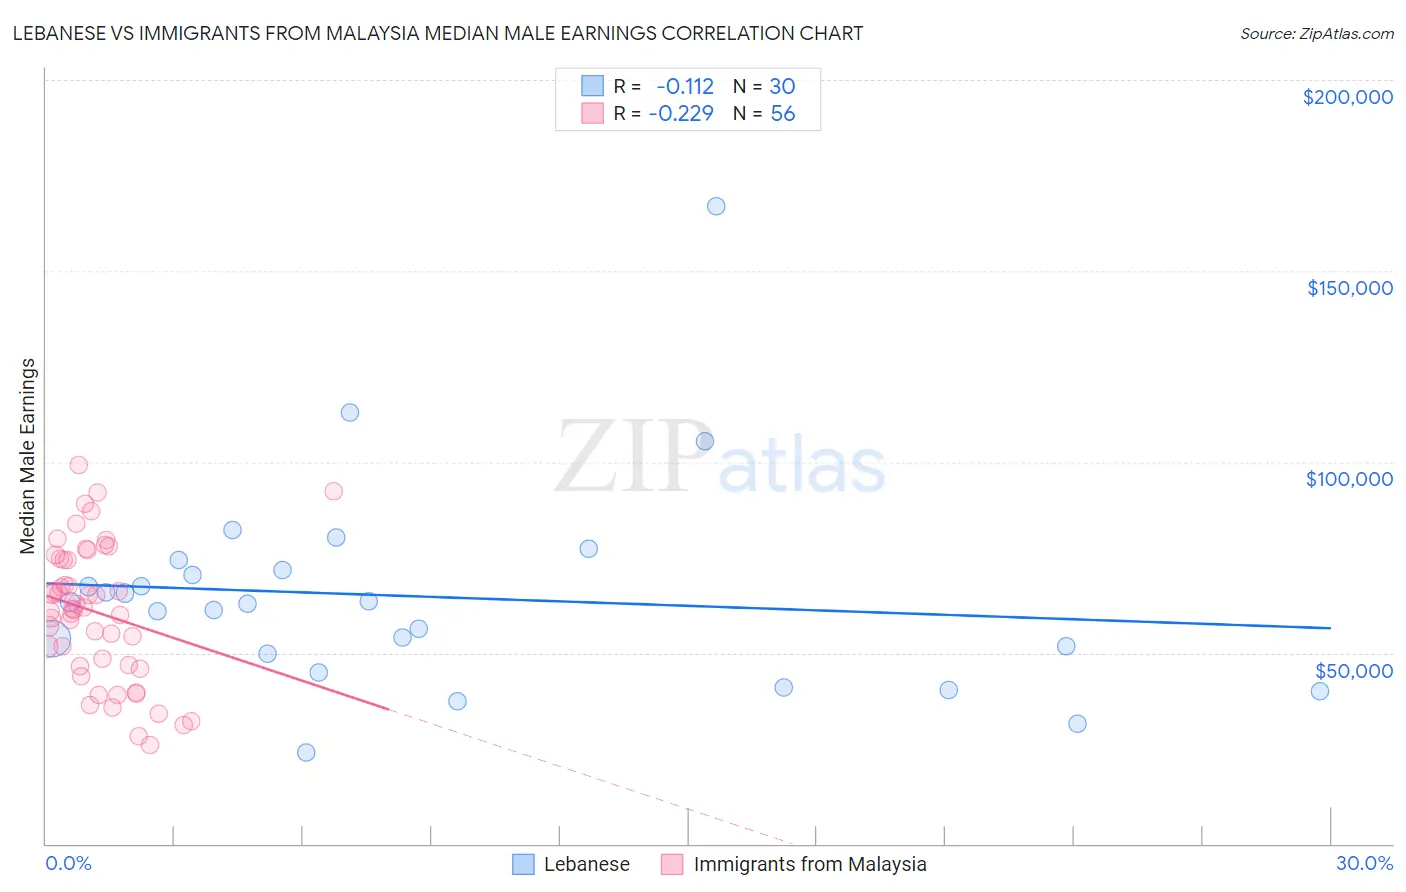
Lebanese vs Immigrants from Malaysia Median Male Earnings Correlation Chart
The statistical analysis conducted on geographies consisting of 401,493,865 people shows a poor negative correlation between the proportion of Lebanese and median male earnings in the United States with a correlation coefficient (R) of -0.112 and weighted average of $57,409. Similarly, the statistical analysis conducted on geographies consisting of 197,949,905 people shows a weak negative correlation between the proportion of Immigrants from Malaysia and median male earnings in the United States with a correlation coefficient (R) of -0.229 and weighted average of $62,121, a difference of 8.2%.
Median Male Earnings Correlation Summary
| Measurement | Lebanese | Immigrants from Malaysia |
| Minimum | $23,959 | $25,921 |
| Maximum | $167,014 | $99,264 |
| Range | $143,055 | $73,343 |
| Mean | $64,779 | $60,570 |
| Median | $62,976 | $61,469 |
| Interquartile 25% (IQ1) | $49,621 | $46,765 |
| Interquartile 75% (IQ3) | $71,843 | $74,461 |
| Interquartile Range (IQR) | $22,221 | $27,696 |
| Standard Deviation (Sample) | $27,382 | $17,826 |
| Standard Deviation (Population) | $26,922 | $17,666 |
Similar Demographics by Median Male Earnings
Demographics Similar to Lebanese by Median Male Earnings
In terms of median male earnings, the demographic groups most similar to Lebanese are Swedish ($57,445, a difference of 0.060%), Immigrants from Zimbabwe ($57,352, a difference of 0.10%), Hungarian ($57,309, a difference of 0.18%), Arab ($57,298, a difference of 0.19%), and Canadian ($57,286, a difference of 0.22%).
| Demographics | Rating | Rank | Median Male Earnings |
| British | 96.5 /100 | #109 | Exceptional $57,890 |
| Palestinians | 96.2 /100 | #110 | Exceptional $57,778 |
| Europeans | 95.6 /100 | #111 | Exceptional $57,637 |
| Immigrants | Afghanistan | 95.4 /100 | #112 | Exceptional $57,582 |
| Carpatho Rusyns | 95.3 /100 | #113 | Exceptional $57,572 |
| Immigrants | Kuwait | 95.3 /100 | #114 | Exceptional $57,562 |
| Swedes | 94.8 /100 | #115 | Exceptional $57,445 |
| Lebanese | 94.6 /100 | #116 | Exceptional $57,409 |
| Immigrants | Zimbabwe | 94.3 /100 | #117 | Exceptional $57,352 |
| Hungarians | 94.0 /100 | #118 | Exceptional $57,309 |
| Arabs | 94.0 /100 | #119 | Exceptional $57,298 |
| Canadians | 93.9 /100 | #120 | Exceptional $57,286 |
| Immigrants | Albania | 93.3 /100 | #121 | Exceptional $57,179 |
| Immigrants | Jordan | 93.1 /100 | #122 | Exceptional $57,145 |
| Slovenes | 93.1 /100 | #123 | Exceptional $57,145 |
Demographics Similar to Immigrants from Malaysia by Median Male Earnings
In terms of median male earnings, the demographic groups most similar to Immigrants from Malaysia are Immigrants from Austria ($62,164, a difference of 0.070%), Immigrants from Europe ($62,057, a difference of 0.10%), Immigrants from Czechoslovakia ($62,217, a difference of 0.15%), Bulgarian ($62,378, a difference of 0.41%), and Bhutanese ($61,759, a difference of 0.59%).
| Demographics | Rating | Rank | Median Male Earnings |
| Immigrants | Turkey | 100.0 /100 | #41 | Exceptional $62,728 |
| Immigrants | Greece | 100.0 /100 | #42 | Exceptional $62,689 |
| Immigrants | Belarus | 100.0 /100 | #43 | Exceptional $62,658 |
| Cambodians | 100.0 /100 | #44 | Exceptional $62,516 |
| Bulgarians | 100.0 /100 | #45 | Exceptional $62,378 |
| Immigrants | Czechoslovakia | 99.9 /100 | #46 | Exceptional $62,217 |
| Immigrants | Austria | 99.9 /100 | #47 | Exceptional $62,164 |
| Immigrants | Malaysia | 99.9 /100 | #48 | Exceptional $62,121 |
| Immigrants | Europe | 99.9 /100 | #49 | Exceptional $62,057 |
| Bhutanese | 99.9 /100 | #50 | Exceptional $61,759 |
| Estonians | 99.9 /100 | #51 | Exceptional $61,710 |
| Immigrants | Norway | 99.9 /100 | #52 | Exceptional $61,628 |
| South Africans | 99.9 /100 | #53 | Exceptional $61,460 |
| Immigrants | Latvia | 99.9 /100 | #54 | Exceptional $61,422 |
| Greeks | 99.9 /100 | #55 | Exceptional $61,242 |