Lebanese vs Immigrants from Western Asia Median Male Earnings
COMPARE
Lebanese
Immigrants from Western Asia
Median Male Earnings
Median Male Earnings Comparison
Lebanese
Immigrants from Western Asia
$57,409
MEDIAN MALE EARNINGS
94.6/ 100
METRIC RATING
116th/ 347
METRIC RANK
$58,131
MEDIAN MALE EARNINGS
97.3/ 100
METRIC RATING
105th/ 347
METRIC RANK
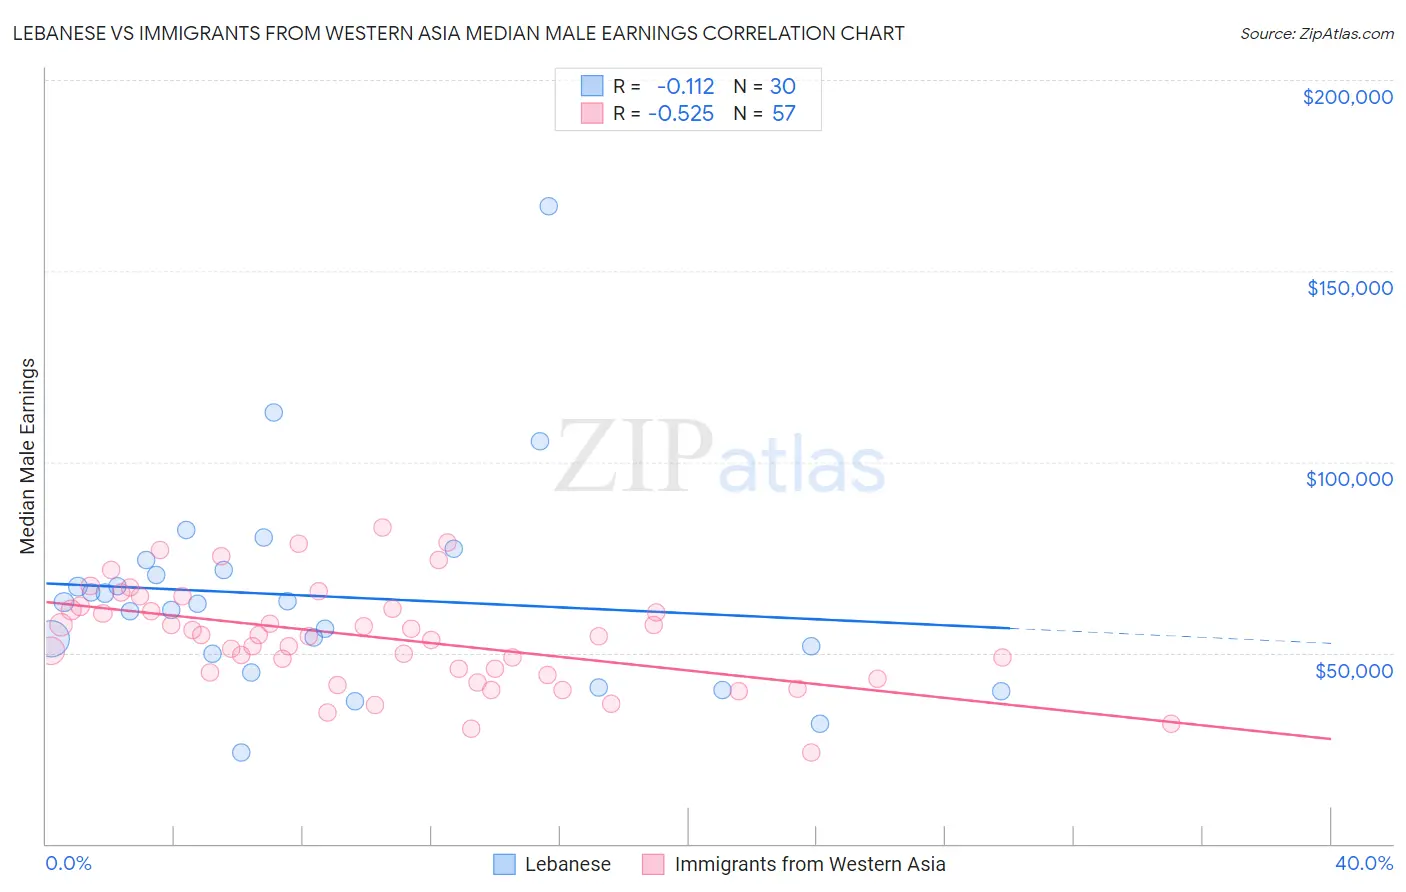
Lebanese vs Immigrants from Western Asia Median Male Earnings Correlation Chart
The statistical analysis conducted on geographies consisting of 401,493,865 people shows a poor negative correlation between the proportion of Lebanese and median male earnings in the United States with a correlation coefficient (R) of -0.112 and weighted average of $57,409. Similarly, the statistical analysis conducted on geographies consisting of 404,325,600 people shows a substantial negative correlation between the proportion of Immigrants from Western Asia and median male earnings in the United States with a correlation coefficient (R) of -0.525 and weighted average of $58,131, a difference of 1.3%.
Median Male Earnings Correlation Summary
| Measurement | Lebanese | Immigrants from Western Asia |
| Minimum | $23,959 | $23,930 |
| Maximum | $167,014 | $82,862 |
| Range | $143,055 | $58,932 |
| Mean | $64,779 | $54,093 |
| Median | $62,976 | $54,361 |
| Interquartile 25% (IQ1) | $49,621 | $44,525 |
| Interquartile 75% (IQ3) | $71,843 | $61,864 |
| Interquartile Range (IQR) | $22,221 | $17,339 |
| Standard Deviation (Sample) | $27,382 | $13,096 |
| Standard Deviation (Population) | $26,922 | $12,981 |
Demographics Similar to Lebanese and Immigrants from Western Asia by Median Male Earnings
In terms of median male earnings, the demographic groups most similar to Lebanese are Swedish ($57,445, a difference of 0.060%), Immigrants from Zimbabwe ($57,352, a difference of 0.10%), Hungarian ($57,309, a difference of 0.18%), Arab ($57,298, a difference of 0.19%), and Canadian ($57,286, a difference of 0.22%). Similarly, the demographic groups most similar to Immigrants from Western Asia are Armenian ($58,134, a difference of 0.010%), Polish ($58,139, a difference of 0.020%), Syrian ($58,187, a difference of 0.10%), Immigrants from Northern Africa ($58,008, a difference of 0.21%), and Serbian ($57,975, a difference of 0.27%).
| Demographics | Rating | Rank | Median Male Earnings |
| Assyrians/Chaldeans/Syriacs | 97.9 /100 | #100 | Exceptional $58,437 |
| Immigrants | Brazil | 97.7 /100 | #101 | Exceptional $58,324 |
| Syrians | 97.4 /100 | #102 | Exceptional $58,187 |
| Poles | 97.3 /100 | #103 | Exceptional $58,139 |
| Armenians | 97.3 /100 | #104 | Exceptional $58,134 |
| Immigrants | Western Asia | 97.3 /100 | #105 | Exceptional $58,131 |
| Immigrants | Northern Africa | 96.9 /100 | #106 | Exceptional $58,008 |
| Serbians | 96.8 /100 | #107 | Exceptional $57,975 |
| Immigrants | Uzbekistan | 96.7 /100 | #108 | Exceptional $57,941 |
| British | 96.5 /100 | #109 | Exceptional $57,890 |
| Palestinians | 96.2 /100 | #110 | Exceptional $57,778 |
| Europeans | 95.6 /100 | #111 | Exceptional $57,637 |
| Immigrants | Afghanistan | 95.4 /100 | #112 | Exceptional $57,582 |
| Carpatho Rusyns | 95.3 /100 | #113 | Exceptional $57,572 |
| Immigrants | Kuwait | 95.3 /100 | #114 | Exceptional $57,562 |
| Swedes | 94.8 /100 | #115 | Exceptional $57,445 |
| Lebanese | 94.6 /100 | #116 | Exceptional $57,409 |
| Immigrants | Zimbabwe | 94.3 /100 | #117 | Exceptional $57,352 |
| Hungarians | 94.0 /100 | #118 | Exceptional $57,309 |
| Arabs | 94.0 /100 | #119 | Exceptional $57,298 |
| Canadians | 93.9 /100 | #120 | Exceptional $57,286 |