Lebanese vs Central American Indian Median Male Earnings
COMPARE
Lebanese
Central American Indian
Median Male Earnings
Median Male Earnings Comparison
Lebanese
Central American Indians
$57,409
MEDIAN MALE EARNINGS
94.6/ 100
METRIC RATING
116th/ 347
METRIC RANK
$47,433
MEDIAN MALE EARNINGS
0.1/ 100
METRIC RATING
295th/ 347
METRIC RANK
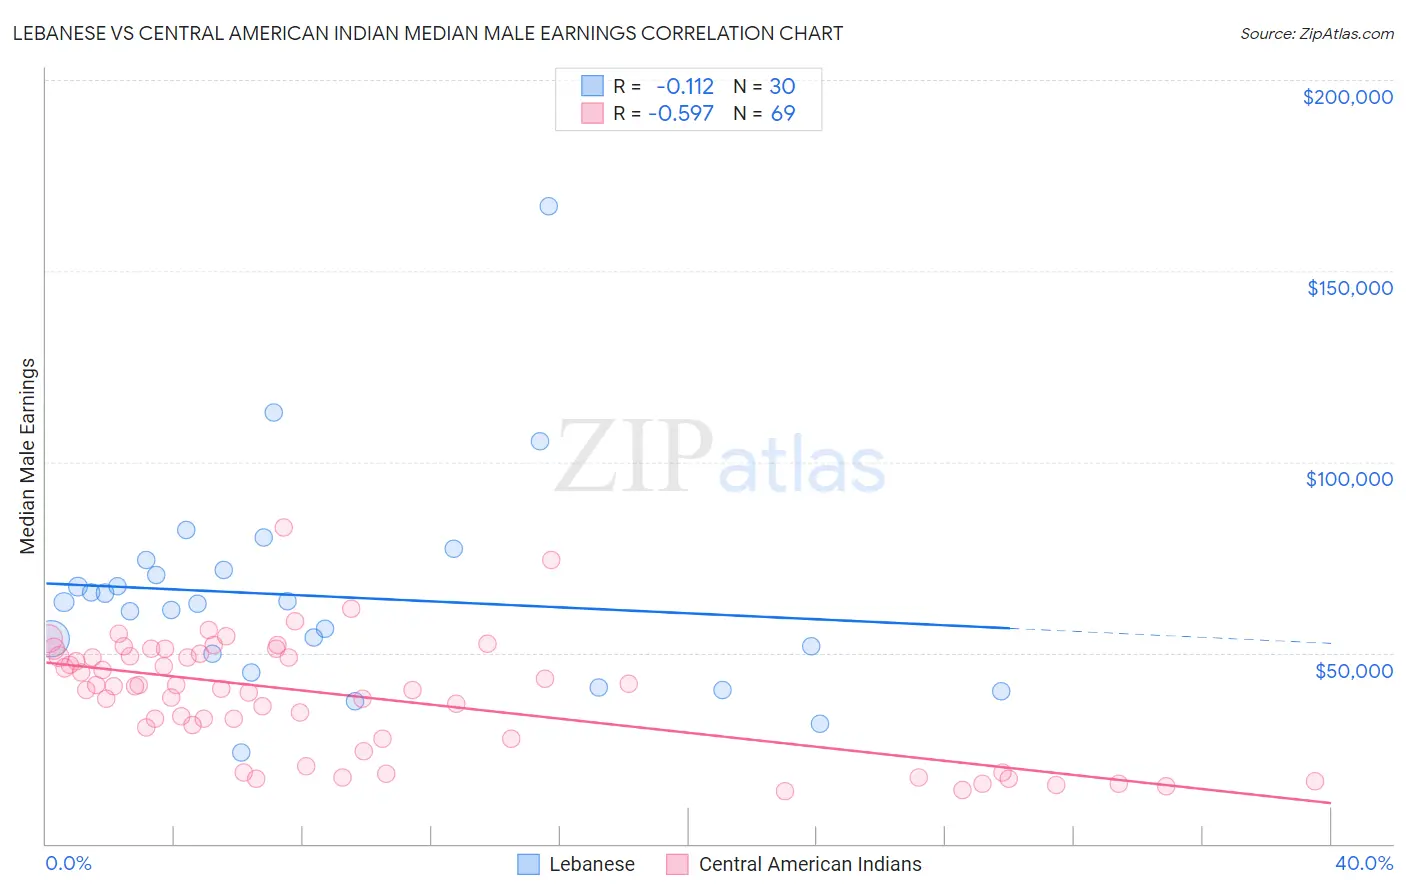
Lebanese vs Central American Indian Median Male Earnings Correlation Chart
The statistical analysis conducted on geographies consisting of 401,493,865 people shows a poor negative correlation between the proportion of Lebanese and median male earnings in the United States with a correlation coefficient (R) of -0.112 and weighted average of $57,409. Similarly, the statistical analysis conducted on geographies consisting of 326,058,906 people shows a substantial negative correlation between the proportion of Central American Indians and median male earnings in the United States with a correlation coefficient (R) of -0.597 and weighted average of $47,433, a difference of 21.0%.
Median Male Earnings Correlation Summary
| Measurement | Lebanese | Central American Indian |
| Minimum | $23,959 | $13,893 |
| Maximum | $167,014 | $82,778 |
| Range | $143,055 | $68,885 |
| Mean | $64,779 | $38,816 |
| Median | $62,976 | $41,080 |
| Interquartile 25% (IQ1) | $49,621 | $27,422 |
| Interquartile 75% (IQ3) | $71,843 | $49,572 |
| Interquartile Range (IQR) | $22,221 | $22,150 |
| Standard Deviation (Sample) | $27,382 | $15,153 |
| Standard Deviation (Population) | $26,922 | $15,043 |
Similar Demographics by Median Male Earnings
Demographics Similar to Lebanese by Median Male Earnings
In terms of median male earnings, the demographic groups most similar to Lebanese are Swedish ($57,445, a difference of 0.060%), Immigrants from Zimbabwe ($57,352, a difference of 0.10%), Hungarian ($57,309, a difference of 0.18%), Arab ($57,298, a difference of 0.19%), and Canadian ($57,286, a difference of 0.22%).
| Demographics | Rating | Rank | Median Male Earnings |
| British | 96.5 /100 | #109 | Exceptional $57,890 |
| Palestinians | 96.2 /100 | #110 | Exceptional $57,778 |
| Europeans | 95.6 /100 | #111 | Exceptional $57,637 |
| Immigrants | Afghanistan | 95.4 /100 | #112 | Exceptional $57,582 |
| Carpatho Rusyns | 95.3 /100 | #113 | Exceptional $57,572 |
| Immigrants | Kuwait | 95.3 /100 | #114 | Exceptional $57,562 |
| Swedes | 94.8 /100 | #115 | Exceptional $57,445 |
| Lebanese | 94.6 /100 | #116 | Exceptional $57,409 |
| Immigrants | Zimbabwe | 94.3 /100 | #117 | Exceptional $57,352 |
| Hungarians | 94.0 /100 | #118 | Exceptional $57,309 |
| Arabs | 94.0 /100 | #119 | Exceptional $57,298 |
| Canadians | 93.9 /100 | #120 | Exceptional $57,286 |
| Immigrants | Albania | 93.3 /100 | #121 | Exceptional $57,179 |
| Immigrants | Jordan | 93.1 /100 | #122 | Exceptional $57,145 |
| Slovenes | 93.1 /100 | #123 | Exceptional $57,145 |
Demographics Similar to Central American Indians by Median Male Earnings
In terms of median male earnings, the demographic groups most similar to Central American Indians are Immigrants from Nicaragua ($47,482, a difference of 0.10%), Indonesian ($47,503, a difference of 0.15%), Inupiat ($47,281, a difference of 0.32%), Immigrants from Dominica ($47,651, a difference of 0.46%), and Dominican ($47,204, a difference of 0.48%).
| Demographics | Rating | Rank | Median Male Earnings |
| Shoshone | 0.2 /100 | #288 | Tragic $47,930 |
| Chickasaw | 0.1 /100 | #289 | Tragic $47,832 |
| Immigrants | Belize | 0.1 /100 | #290 | Tragic $47,809 |
| Choctaw | 0.1 /100 | #291 | Tragic $47,729 |
| Immigrants | Dominica | 0.1 /100 | #292 | Tragic $47,651 |
| Indonesians | 0.1 /100 | #293 | Tragic $47,503 |
| Immigrants | Nicaragua | 0.1 /100 | #294 | Tragic $47,482 |
| Central American Indians | 0.1 /100 | #295 | Tragic $47,433 |
| Inupiat | 0.1 /100 | #296 | Tragic $47,281 |
| Dominicans | 0.1 /100 | #297 | Tragic $47,204 |
| Immigrants | Micronesia | 0.1 /100 | #298 | Tragic $47,177 |
| Immigrants | Zaire | 0.1 /100 | #299 | Tragic $47,070 |
| U.S. Virgin Islanders | 0.1 /100 | #300 | Tragic $47,066 |
| Immigrants | Latin America | 0.1 /100 | #301 | Tragic $46,941 |
| Seminole | 0.1 /100 | #302 | Tragic $46,783 |