Armenian vs Haitian Median Male Earnings
COMPARE
Armenian
Haitian
Median Male Earnings
Median Male Earnings Comparison
Armenians
Haitians
$58,134
MEDIAN MALE EARNINGS
97.3/ 100
METRIC RATING
104th/ 347
METRIC RANK
$45,903
MEDIAN MALE EARNINGS
0.0/ 100
METRIC RATING
319th/ 347
METRIC RANK
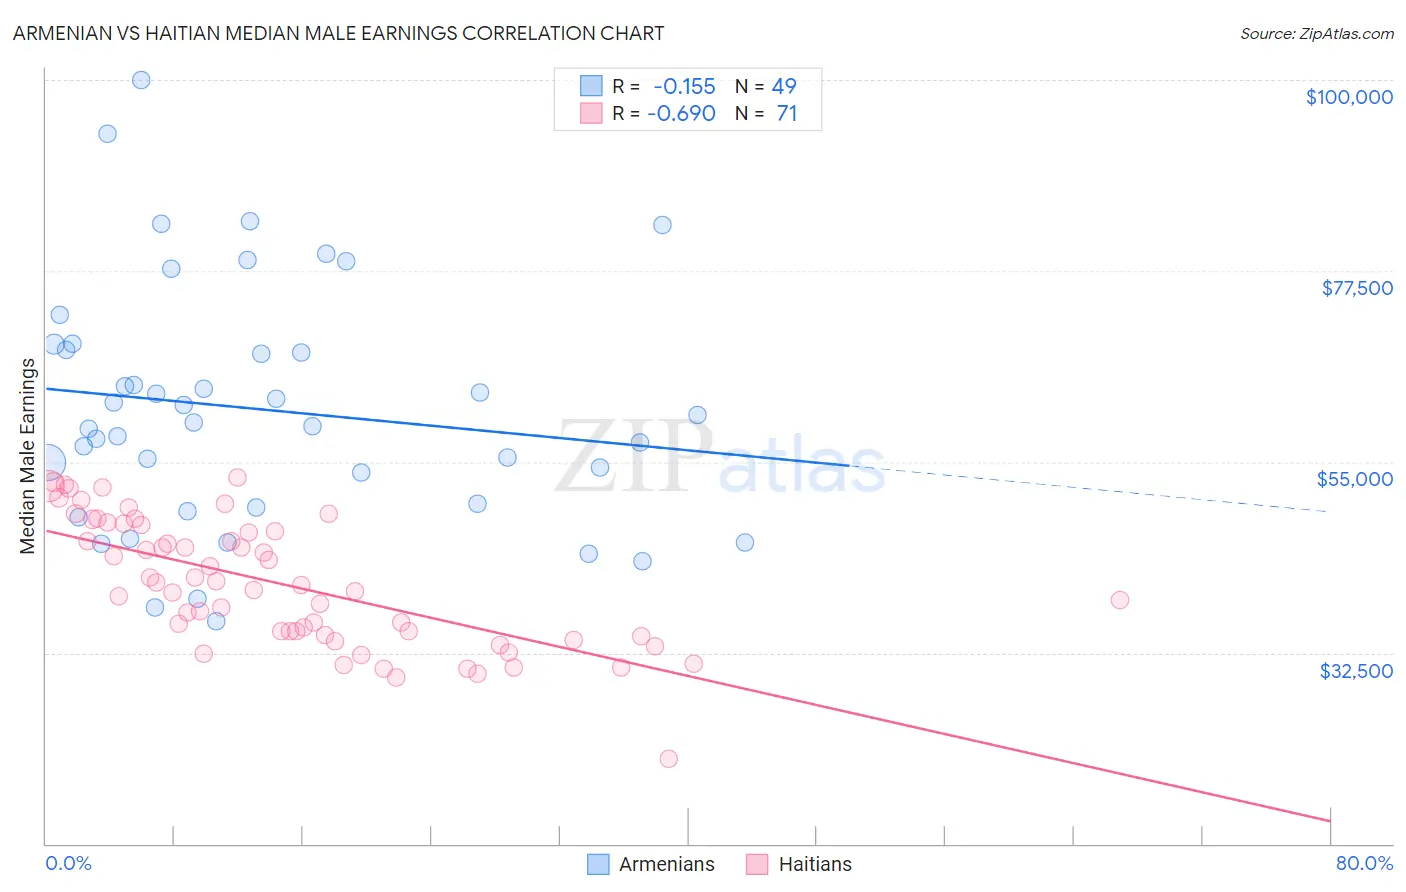
Armenian vs Haitian Median Male Earnings Correlation Chart
The statistical analysis conducted on geographies consisting of 310,896,747 people shows a poor negative correlation between the proportion of Armenians and median male earnings in the United States with a correlation coefficient (R) of -0.155 and weighted average of $58,134. Similarly, the statistical analysis conducted on geographies consisting of 287,952,359 people shows a significant negative correlation between the proportion of Haitians and median male earnings in the United States with a correlation coefficient (R) of -0.690 and weighted average of $45,903, a difference of 26.6%.
Median Male Earnings Correlation Summary
| Measurement | Armenian | Haitian |
| Minimum | $36,151 | $19,963 |
| Maximum | $99,997 | $53,128 |
| Range | $63,846 | $33,165 |
| Mean | $61,183 | $40,657 |
| Median | $59,670 | $40,467 |
| Interquartile 25% (IQ1) | $49,867 | $34,672 |
| Interquartile 75% (IQ3) | $68,550 | $47,602 |
| Interquartile Range (IQR) | $18,683 | $12,930 |
| Standard Deviation (Sample) | $14,235 | $7,455 |
| Standard Deviation (Population) | $14,089 | $7,403 |
Similar Demographics by Median Male Earnings
Demographics Similar to Armenians by Median Male Earnings
In terms of median male earnings, the demographic groups most similar to Armenians are Polish ($58,139, a difference of 0.010%), Immigrants from Western Asia ($58,131, a difference of 0.010%), Syrian ($58,187, a difference of 0.090%), Immigrants from Northern Africa ($58,008, a difference of 0.22%), and Serbian ($57,975, a difference of 0.27%).
| Demographics | Rating | Rank | Median Male Earnings |
| Northern Europeans | 98.2 /100 | #97 | Exceptional $58,588 |
| Jordanians | 98.1 /100 | #98 | Exceptional $58,500 |
| Immigrants | Poland | 98.0 /100 | #99 | Exceptional $58,452 |
| Assyrians/Chaldeans/Syriacs | 97.9 /100 | #100 | Exceptional $58,437 |
| Immigrants | Brazil | 97.7 /100 | #101 | Exceptional $58,324 |
| Syrians | 97.4 /100 | #102 | Exceptional $58,187 |
| Poles | 97.3 /100 | #103 | Exceptional $58,139 |
| Armenians | 97.3 /100 | #104 | Exceptional $58,134 |
| Immigrants | Western Asia | 97.3 /100 | #105 | Exceptional $58,131 |
| Immigrants | Northern Africa | 96.9 /100 | #106 | Exceptional $58,008 |
| Serbians | 96.8 /100 | #107 | Exceptional $57,975 |
| Immigrants | Uzbekistan | 96.7 /100 | #108 | Exceptional $57,941 |
| British | 96.5 /100 | #109 | Exceptional $57,890 |
| Palestinians | 96.2 /100 | #110 | Exceptional $57,778 |
| Europeans | 95.6 /100 | #111 | Exceptional $57,637 |
Demographics Similar to Haitians by Median Male Earnings
In terms of median male earnings, the demographic groups most similar to Haitians are Immigrants from Honduras ($45,787, a difference of 0.25%), Cheyenne ($46,062, a difference of 0.35%), Mexican ($46,147, a difference of 0.53%), Immigrants from Caribbean ($46,193, a difference of 0.63%), and Fijian ($45,607, a difference of 0.65%).
| Demographics | Rating | Rank | Median Male Earnings |
| Hispanics or Latinos | 0.0 /100 | #312 | Tragic $46,419 |
| Hondurans | 0.0 /100 | #313 | Tragic $46,374 |
| Chippewa | 0.0 /100 | #314 | Tragic $46,368 |
| Immigrants | Guatemala | 0.0 /100 | #315 | Tragic $46,244 |
| Immigrants | Caribbean | 0.0 /100 | #316 | Tragic $46,193 |
| Mexicans | 0.0 /100 | #317 | Tragic $46,147 |
| Cheyenne | 0.0 /100 | #318 | Tragic $46,062 |
| Haitians | 0.0 /100 | #319 | Tragic $45,903 |
| Immigrants | Honduras | 0.0 /100 | #320 | Tragic $45,787 |
| Fijians | 0.0 /100 | #321 | Tragic $45,607 |
| Sioux | 0.0 /100 | #322 | Tragic $45,566 |
| Immigrants | Central America | 0.0 /100 | #323 | Tragic $45,538 |
| Blacks/African Americans | 0.0 /100 | #324 | Tragic $45,523 |
| Yuman | 0.0 /100 | #325 | Tragic $45,446 |
| Immigrants | Haiti | 0.0 /100 | #326 | Tragic $45,266 |