Lebanese vs Menominee Median Male Earnings
COMPARE
Lebanese
Menominee
Median Male Earnings
Median Male Earnings Comparison
Lebanese
Menominee
$57,409
MEDIAN MALE EARNINGS
94.6/ 100
METRIC RATING
116th/ 347
METRIC RANK
$42,581
MEDIAN MALE EARNINGS
0.0/ 100
METRIC RATING
337th/ 347
METRIC RANK
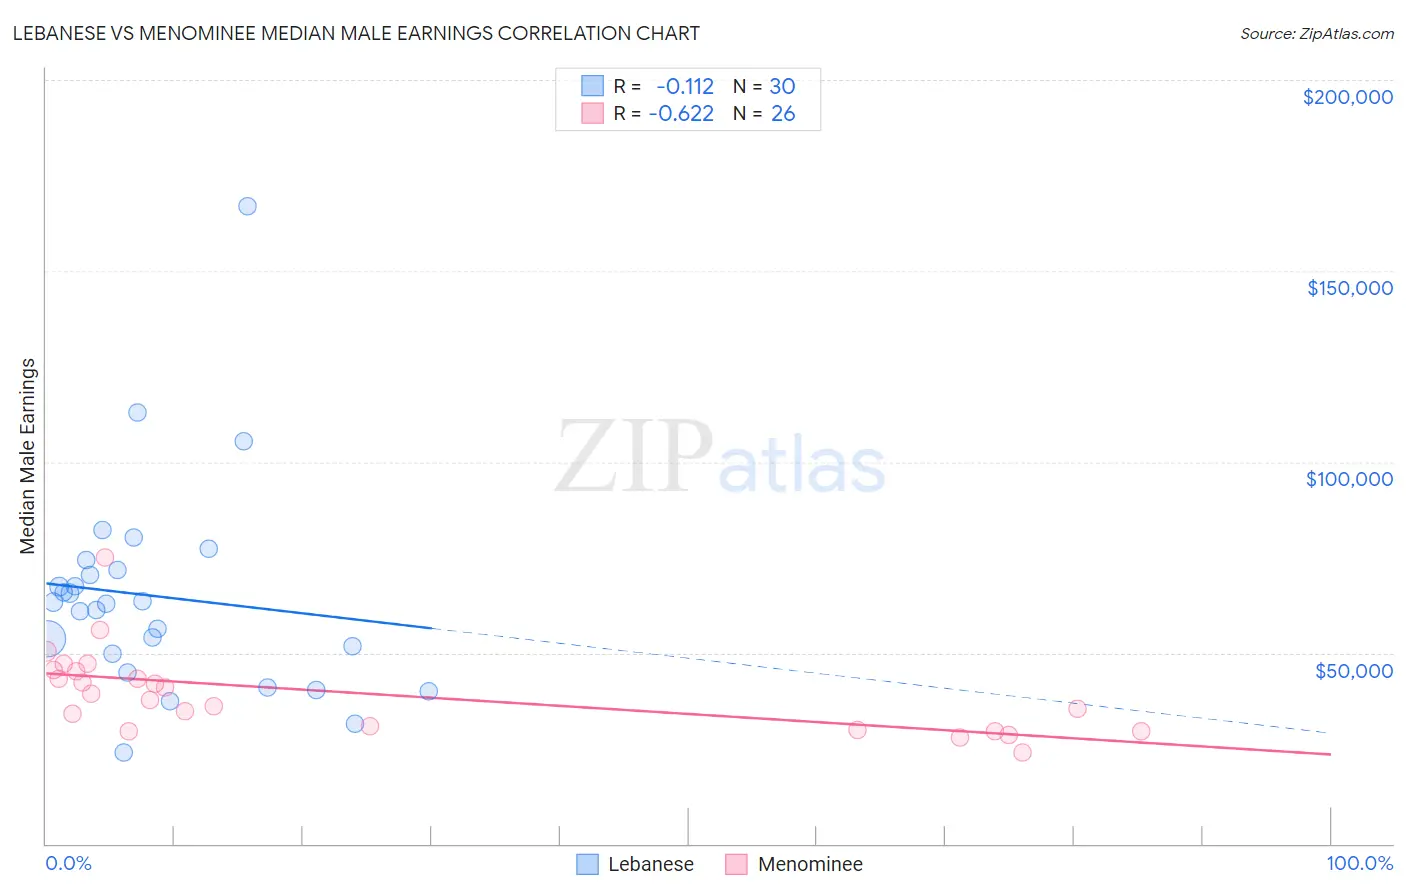
Lebanese vs Menominee Median Male Earnings Correlation Chart
The statistical analysis conducted on geographies consisting of 401,493,865 people shows a poor negative correlation between the proportion of Lebanese and median male earnings in the United States with a correlation coefficient (R) of -0.112 and weighted average of $57,409. Similarly, the statistical analysis conducted on geographies consisting of 45,775,457 people shows a significant negative correlation between the proportion of Menominee and median male earnings in the United States with a correlation coefficient (R) of -0.622 and weighted average of $42,581, a difference of 34.8%.
Median Male Earnings Correlation Summary
| Measurement | Lebanese | Menominee |
| Minimum | $23,959 | $23,828 |
| Maximum | $167,014 | $75,000 |
| Range | $143,055 | $51,172 |
| Mean | $64,779 | $39,395 |
| Median | $62,976 | $38,495 |
| Interquartile 25% (IQ1) | $49,621 | $29,844 |
| Interquartile 75% (IQ3) | $71,843 | $45,222 |
| Interquartile Range (IQR) | $22,221 | $15,378 |
| Standard Deviation (Sample) | $27,382 | $10,853 |
| Standard Deviation (Population) | $26,922 | $10,643 |
Similar Demographics by Median Male Earnings
Demographics Similar to Lebanese by Median Male Earnings
In terms of median male earnings, the demographic groups most similar to Lebanese are Swedish ($57,445, a difference of 0.060%), Immigrants from Zimbabwe ($57,352, a difference of 0.10%), Hungarian ($57,309, a difference of 0.18%), Arab ($57,298, a difference of 0.19%), and Canadian ($57,286, a difference of 0.22%).
| Demographics | Rating | Rank | Median Male Earnings |
| British | 96.5 /100 | #109 | Exceptional $57,890 |
| Palestinians | 96.2 /100 | #110 | Exceptional $57,778 |
| Europeans | 95.6 /100 | #111 | Exceptional $57,637 |
| Immigrants | Afghanistan | 95.4 /100 | #112 | Exceptional $57,582 |
| Carpatho Rusyns | 95.3 /100 | #113 | Exceptional $57,572 |
| Immigrants | Kuwait | 95.3 /100 | #114 | Exceptional $57,562 |
| Swedes | 94.8 /100 | #115 | Exceptional $57,445 |
| Lebanese | 94.6 /100 | #116 | Exceptional $57,409 |
| Immigrants | Zimbabwe | 94.3 /100 | #117 | Exceptional $57,352 |
| Hungarians | 94.0 /100 | #118 | Exceptional $57,309 |
| Arabs | 94.0 /100 | #119 | Exceptional $57,298 |
| Canadians | 93.9 /100 | #120 | Exceptional $57,286 |
| Immigrants | Albania | 93.3 /100 | #121 | Exceptional $57,179 |
| Immigrants | Jordan | 93.1 /100 | #122 | Exceptional $57,145 |
| Slovenes | 93.1 /100 | #123 | Exceptional $57,145 |
Demographics Similar to Menominee by Median Male Earnings
In terms of median male earnings, the demographic groups most similar to Menominee are Crow ($42,434, a difference of 0.35%), Pima ($42,357, a difference of 0.53%), Navajo ($42,098, a difference of 1.1%), Hopi ($42,060, a difference of 1.2%), and Arapaho ($41,758, a difference of 2.0%).
| Demographics | Rating | Rank | Median Male Earnings |
| Immigrants | Mexico | 0.0 /100 | #330 | Tragic $44,960 |
| Natives/Alaskans | 0.0 /100 | #331 | Tragic $44,775 |
| Bahamians | 0.0 /100 | #332 | Tragic $44,756 |
| Immigrants | Congo | 0.0 /100 | #333 | Tragic $44,204 |
| Immigrants | Yemen | 0.0 /100 | #334 | Tragic $44,083 |
| Spanish American Indians | 0.0 /100 | #335 | Tragic $44,010 |
| Immigrants | Cuba | 0.0 /100 | #336 | Tragic $43,461 |
| Menominee | 0.0 /100 | #337 | Tragic $42,581 |
| Crow | 0.0 /100 | #338 | Tragic $42,434 |
| Pima | 0.0 /100 | #339 | Tragic $42,357 |
| Navajo | 0.0 /100 | #340 | Tragic $42,098 |
| Hopi | 0.0 /100 | #341 | Tragic $42,060 |
| Arapaho | 0.0 /100 | #342 | Tragic $41,758 |
| Lumbee | 0.0 /100 | #343 | Tragic $41,715 |
| Pueblo | 0.0 /100 | #344 | Tragic $41,314 |