Lebanese vs Immigrants from Egypt Median Male Earnings
COMPARE
Lebanese
Immigrants from Egypt
Median Male Earnings
Median Male Earnings Comparison
Lebanese
Immigrants from Egypt
$57,409
MEDIAN MALE EARNINGS
94.6/ 100
METRIC RATING
116th/ 347
METRIC RANK
$59,925
MEDIAN MALE EARNINGS
99.5/ 100
METRIC RATING
78th/ 347
METRIC RANK
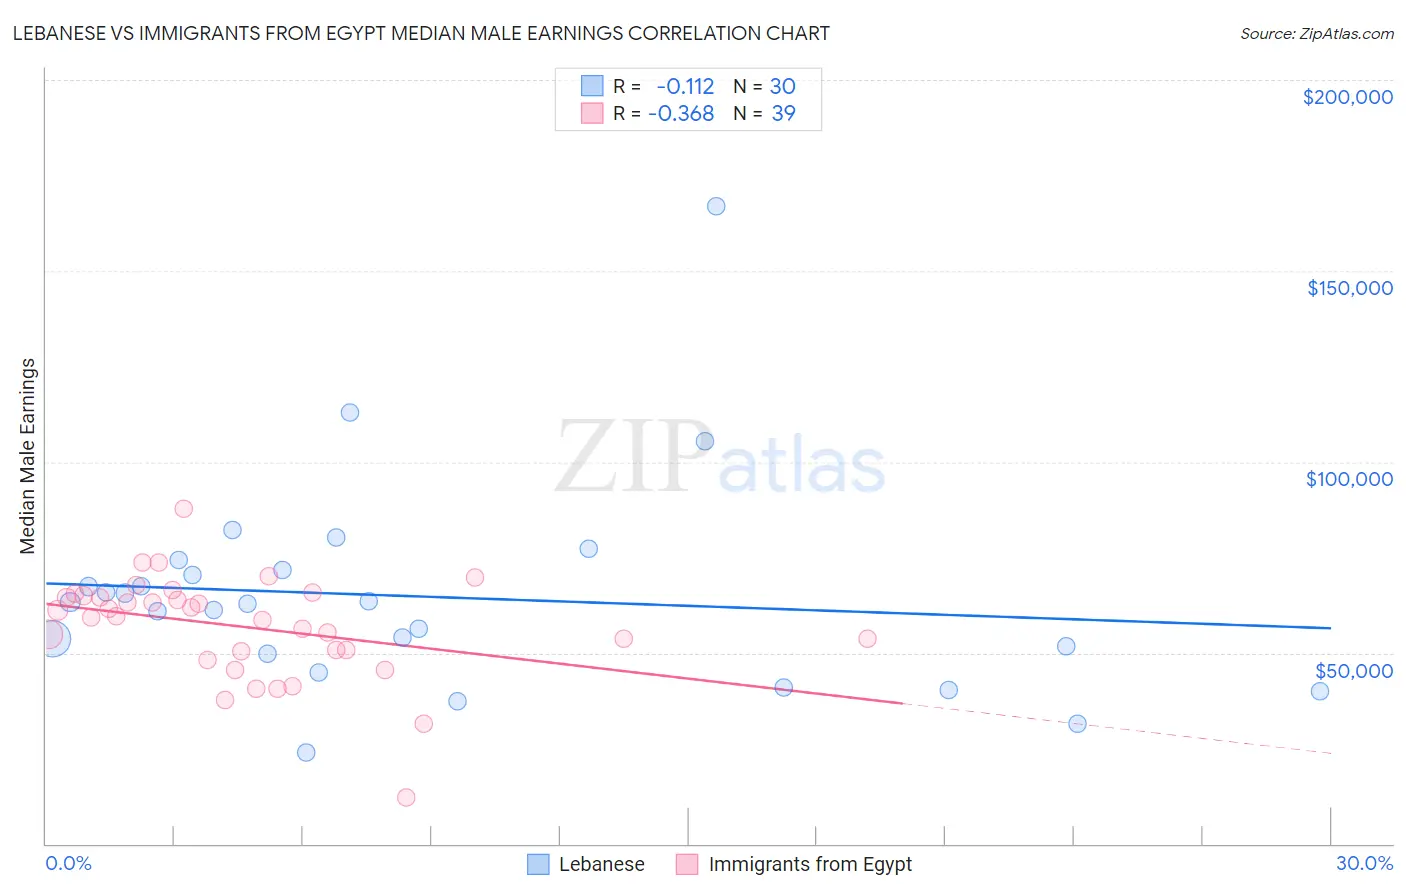
Lebanese vs Immigrants from Egypt Median Male Earnings Correlation Chart
The statistical analysis conducted on geographies consisting of 401,493,865 people shows a poor negative correlation between the proportion of Lebanese and median male earnings in the United States with a correlation coefficient (R) of -0.112 and weighted average of $57,409. Similarly, the statistical analysis conducted on geographies consisting of 245,462,607 people shows a mild negative correlation between the proportion of Immigrants from Egypt and median male earnings in the United States with a correlation coefficient (R) of -0.368 and weighted average of $59,925, a difference of 4.4%.
Median Male Earnings Correlation Summary
| Measurement | Lebanese | Immigrants from Egypt |
| Minimum | $23,959 | $12,000 |
| Maximum | $167,014 | $87,885 |
| Range | $143,055 | $75,885 |
| Mean | $64,779 | $56,843 |
| Median | $62,976 | $59,590 |
| Interquartile 25% (IQ1) | $49,621 | $50,375 |
| Interquartile 75% (IQ3) | $71,843 | $64,984 |
| Interquartile Range (IQR) | $22,221 | $14,609 |
| Standard Deviation (Sample) | $27,382 | $13,509 |
| Standard Deviation (Population) | $26,922 | $13,335 |
Similar Demographics by Median Male Earnings
Demographics Similar to Lebanese by Median Male Earnings
In terms of median male earnings, the demographic groups most similar to Lebanese are Swedish ($57,445, a difference of 0.060%), Immigrants from Zimbabwe ($57,352, a difference of 0.10%), Hungarian ($57,309, a difference of 0.18%), Arab ($57,298, a difference of 0.19%), and Canadian ($57,286, a difference of 0.22%).
| Demographics | Rating | Rank | Median Male Earnings |
| British | 96.5 /100 | #109 | Exceptional $57,890 |
| Palestinians | 96.2 /100 | #110 | Exceptional $57,778 |
| Europeans | 95.6 /100 | #111 | Exceptional $57,637 |
| Immigrants | Afghanistan | 95.4 /100 | #112 | Exceptional $57,582 |
| Carpatho Rusyns | 95.3 /100 | #113 | Exceptional $57,572 |
| Immigrants | Kuwait | 95.3 /100 | #114 | Exceptional $57,562 |
| Swedes | 94.8 /100 | #115 | Exceptional $57,445 |
| Lebanese | 94.6 /100 | #116 | Exceptional $57,409 |
| Immigrants | Zimbabwe | 94.3 /100 | #117 | Exceptional $57,352 |
| Hungarians | 94.0 /100 | #118 | Exceptional $57,309 |
| Arabs | 94.0 /100 | #119 | Exceptional $57,298 |
| Canadians | 93.9 /100 | #120 | Exceptional $57,286 |
| Immigrants | Albania | 93.3 /100 | #121 | Exceptional $57,179 |
| Immigrants | Jordan | 93.1 /100 | #122 | Exceptional $57,145 |
| Slovenes | 93.1 /100 | #123 | Exceptional $57,145 |
Demographics Similar to Immigrants from Egypt by Median Male Earnings
In terms of median male earnings, the demographic groups most similar to Immigrants from Egypt are Paraguayan ($59,975, a difference of 0.080%), Immigrants from Ukraine ($59,820, a difference of 0.18%), Immigrants from Hungary ($59,806, a difference of 0.20%), Romanian ($60,063, a difference of 0.23%), and Immigrants from Bolivia ($60,088, a difference of 0.27%).
| Demographics | Rating | Rank | Median Male Earnings |
| Mongolians | 99.7 /100 | #71 | Exceptional $60,350 |
| Immigrants | Western Europe | 99.7 /100 | #72 | Exceptional $60,334 |
| Immigrants | North America | 99.7 /100 | #73 | Exceptional $60,265 |
| Argentineans | 99.6 /100 | #74 | Exceptional $60,117 |
| Immigrants | Bolivia | 99.6 /100 | #75 | Exceptional $60,088 |
| Romanians | 99.6 /100 | #76 | Exceptional $60,063 |
| Paraguayans | 99.5 /100 | #77 | Exceptional $59,975 |
| Immigrants | Egypt | 99.5 /100 | #78 | Exceptional $59,925 |
| Immigrants | Ukraine | 99.5 /100 | #79 | Exceptional $59,820 |
| Immigrants | Hungary | 99.5 /100 | #80 | Exceptional $59,806 |
| Ukrainians | 99.4 /100 | #81 | Exceptional $59,728 |
| Croatians | 99.4 /100 | #82 | Exceptional $59,715 |
| Immigrants | Italy | 99.4 /100 | #83 | Exceptional $59,691 |
| Afghans | 99.3 /100 | #84 | Exceptional $59,554 |
| Italians | 99.3 /100 | #85 | Exceptional $59,551 |