Nicaraguan vs German Russian Wage/Income Gap
COMPARE
Nicaraguan
German Russian
Wage/Income Gap
Wage/Income Gap Comparison
Nicaraguans
German Russians
23.4%
WAGE/INCOME GAP
99.6/ 100
METRIC RATING
90th/ 347
METRIC RANK
24.6%
WAGE/INCOME GAP
93.7/ 100
METRIC RATING
127th/ 347
METRIC RANK
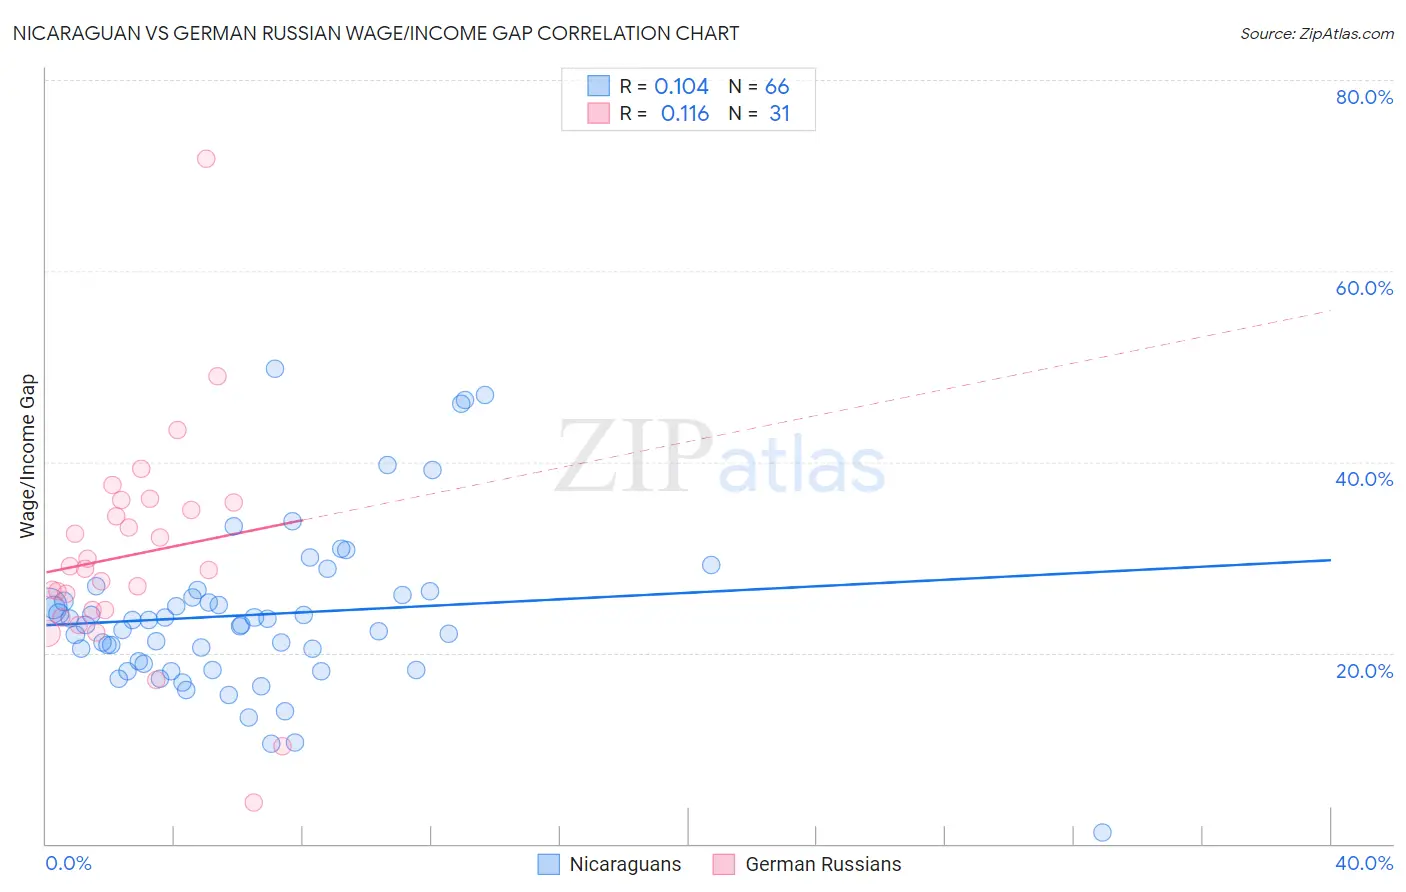
Nicaraguan vs German Russian Wage/Income Gap Correlation Chart
The statistical analysis conducted on geographies consisting of 285,636,386 people shows a poor positive correlation between the proportion of Nicaraguans and wage/income gap percentage in the United States with a correlation coefficient (R) of 0.104 and weighted average of 23.4%. Similarly, the statistical analysis conducted on geographies consisting of 96,446,629 people shows a poor positive correlation between the proportion of German Russians and wage/income gap percentage in the United States with a correlation coefficient (R) of 0.116 and weighted average of 24.6%, a difference of 5.1%.
Wage/Income Gap Correlation Summary
| Measurement | Nicaraguan | German Russian |
| Minimum | 1.2% | 4.3% |
| Maximum | 49.8% | 71.8% |
| Range | 48.6% | 67.5% |
| Mean | 24.0% | 30.2% |
| Median | 23.2% | 28.8% |
| Interquartile 25% (IQ1) | 18.9% | 24.4% |
| Interquartile 75% (IQ3) | 26.0% | 35.8% |
| Interquartile Range (IQR) | 7.1% | 11.3% |
| Standard Deviation (Sample) | 8.6% | 11.8% |
| Standard Deviation (Population) | 8.5% | 11.6% |
Similar Demographics by Wage/Income Gap
Demographics Similar to Nicaraguans by Wage/Income Gap
In terms of wage/income gap, the demographic groups most similar to Nicaraguans are Marshallese (23.4%, a difference of 0.010%), Immigrants from Panama (23.4%, a difference of 0.10%), Arapaho (23.5%, a difference of 0.14%), Immigrants from Honduras (23.5%, a difference of 0.29%), and Yuman (23.3%, a difference of 0.42%).
| Demographics | Rating | Rank | Wage/Income Gap |
| Immigrants | Africa | 99.8 /100 | #83 | Exceptional 23.2% |
| Cubans | 99.7 /100 | #84 | Exceptional 23.3% |
| Immigrants | Cambodia | 99.7 /100 | #85 | Exceptional 23.3% |
| Cheyenne | 99.7 /100 | #86 | Exceptional 23.3% |
| Yuman | 99.7 /100 | #87 | Exceptional 23.3% |
| Immigrants | Panama | 99.6 /100 | #88 | Exceptional 23.4% |
| Marshallese | 99.6 /100 | #89 | Exceptional 23.4% |
| Nicaraguans | 99.6 /100 | #90 | Exceptional 23.4% |
| Arapaho | 99.6 /100 | #91 | Exceptional 23.5% |
| Immigrants | Honduras | 99.5 /100 | #92 | Exceptional 23.5% |
| Immigrants | Cabo Verde | 99.5 /100 | #93 | Exceptional 23.6% |
| Hondurans | 99.5 /100 | #94 | Exceptional 23.6% |
| Cape Verdeans | 99.4 /100 | #95 | Exceptional 23.6% |
| Kiowa | 99.4 /100 | #96 | Exceptional 23.6% |
| Immigrants | Sudan | 99.4 /100 | #97 | Exceptional 23.6% |
Demographics Similar to German Russians by Wage/Income Gap
In terms of wage/income gap, the demographic groups most similar to German Russians are Immigrants from Uruguay (24.6%, a difference of 0.010%), Spanish American (24.6%, a difference of 0.020%), Immigrants from South America (24.6%, a difference of 0.050%), Immigrants from Central America (24.6%, a difference of 0.070%), and Yup'ik (24.7%, a difference of 0.12%).
| Demographics | Rating | Rank | Wage/Income Gap |
| Cree | 95.6 /100 | #120 | Exceptional 24.5% |
| Immigrants | Thailand | 94.9 /100 | #121 | Exceptional 24.5% |
| Apache | 94.8 /100 | #122 | Exceptional 24.5% |
| Natives/Alaskans | 94.6 /100 | #123 | Exceptional 24.6% |
| Immigrants | South America | 93.9 /100 | #124 | Exceptional 24.6% |
| Spanish Americans | 93.8 /100 | #125 | Exceptional 24.6% |
| Immigrants | Uruguay | 93.8 /100 | #126 | Exceptional 24.6% |
| German Russians | 93.7 /100 | #127 | Exceptional 24.6% |
| Immigrants | Central America | 93.5 /100 | #128 | Exceptional 24.6% |
| Yup'ik | 93.3 /100 | #129 | Exceptional 24.7% |
| Alsatians | 93.2 /100 | #130 | Exceptional 24.7% |
| Immigrants | Philippines | 93.0 /100 | #131 | Exceptional 24.7% |
| Immigrants | Costa Rica | 92.4 /100 | #132 | Exceptional 24.7% |
| Colombians | 92.4 /100 | #133 | Exceptional 24.7% |
| Mexican American Indians | 92.2 /100 | #134 | Exceptional 24.7% |