Chilean vs Immigrants from Latvia Wage/Income Gap
COMPARE
Chilean
Immigrants from Latvia
Wage/Income Gap
Wage/Income Gap Comparison
Chileans
Immigrants from Latvia
26.3%
WAGE/INCOME GAP
22.3/ 100
METRIC RATING
194th/ 347
METRIC RANK
26.7%
WAGE/INCOME GAP
8.9/ 100
METRIC RATING
220th/ 347
METRIC RANK
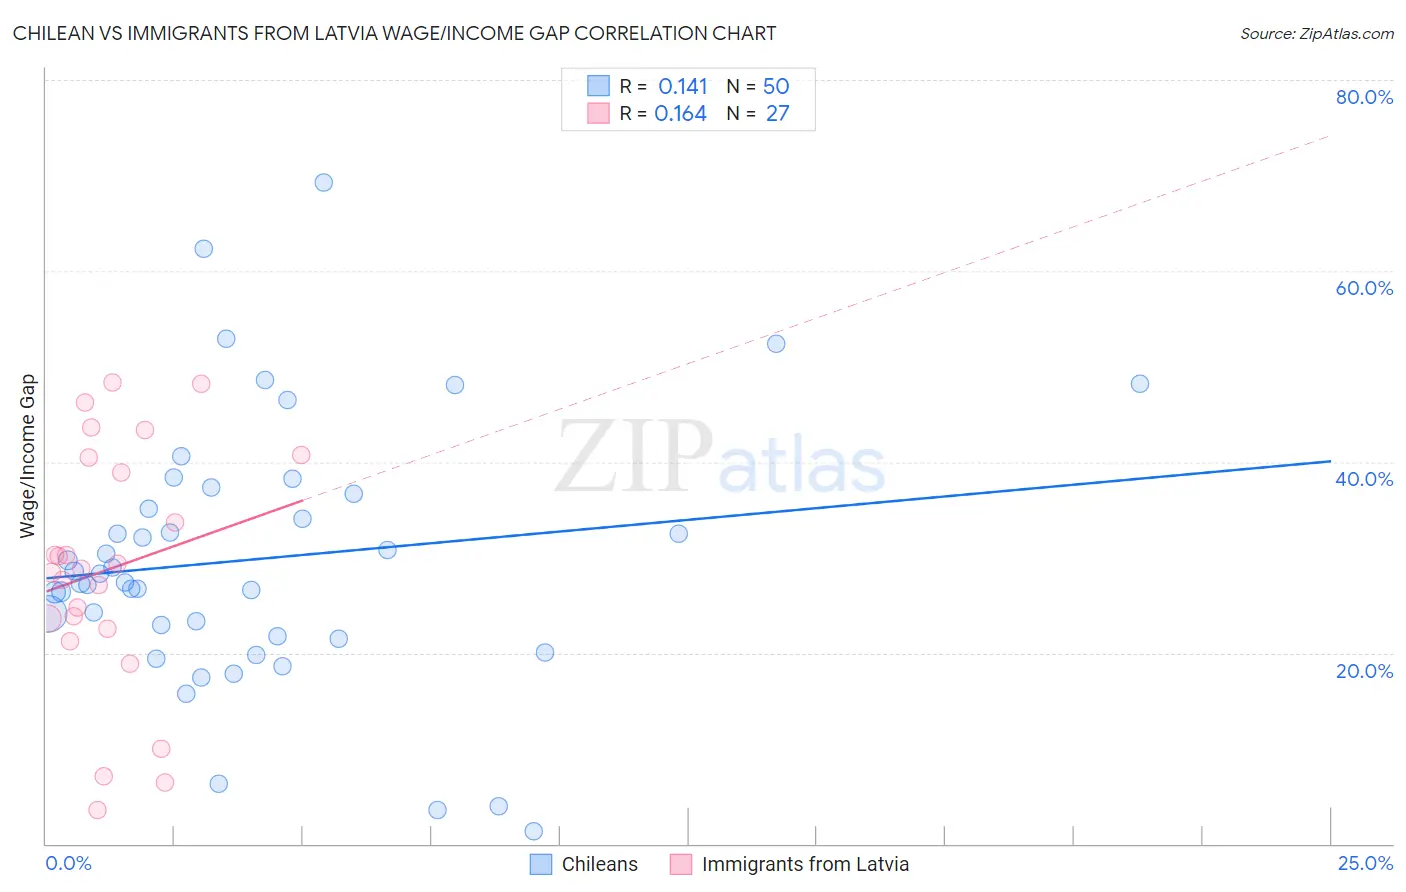
Chilean vs Immigrants from Latvia Wage/Income Gap Correlation Chart
The statistical analysis conducted on geographies consisting of 256,626,155 people shows a poor positive correlation between the proportion of Chileans and wage/income gap percentage in the United States with a correlation coefficient (R) of 0.141 and weighted average of 26.3%. Similarly, the statistical analysis conducted on geographies consisting of 113,720,883 people shows a poor positive correlation between the proportion of Immigrants from Latvia and wage/income gap percentage in the United States with a correlation coefficient (R) of 0.164 and weighted average of 26.7%, a difference of 1.7%.
Wage/Income Gap Correlation Summary
| Measurement | Chilean | Immigrants from Latvia |
| Minimum | 1.3% | 3.5% |
| Maximum | 69.3% | 48.4% |
| Range | 68.1% | 44.8% |
| Mean | 29.8% | 28.8% |
| Median | 27.8% | 28.9% |
| Interquartile 25% (IQ1) | 21.7% | 22.5% |
| Interquartile 75% (IQ3) | 36.7% | 40.4% |
| Interquartile Range (IQR) | 15.0% | 18.0% |
| Standard Deviation (Sample) | 13.9% | 12.6% |
| Standard Deviation (Population) | 13.7% | 12.4% |
Similar Demographics by Wage/Income Gap
Demographics Similar to Chileans by Wage/Income Gap
In terms of wage/income gap, the demographic groups most similar to Chileans are Immigrants from Jordan (26.3%, a difference of 0.0%), Immigrants from Malaysia (26.3%, a difference of 0.010%), Immigrants from Bulgaria (26.3%, a difference of 0.020%), Immigrants from Western Asia (26.3%, a difference of 0.060%), and Zimbabwean (26.3%, a difference of 0.070%).
| Demographics | Rating | Rank | Wage/Income Gap |
| Palestinians | 29.9 /100 | #187 | Fair 26.1% |
| Immigrants | Egypt | 29.9 /100 | #188 | Fair 26.1% |
| Immigrants | Moldova | 26.6 /100 | #189 | Fair 26.2% |
| Immigrants | Croatia | 24.8 /100 | #190 | Fair 26.2% |
| Immigrants | Venezuela | 24.7 /100 | #191 | Fair 26.2% |
| Immigrants | Bulgaria | 22.5 /100 | #192 | Fair 26.3% |
| Immigrants | Jordan | 22.4 /100 | #193 | Fair 26.3% |
| Chileans | 22.3 /100 | #194 | Fair 26.3% |
| Immigrants | Malaysia | 22.2 /100 | #195 | Fair 26.3% |
| Immigrants | Western Asia | 21.7 /100 | #196 | Fair 26.3% |
| Zimbabweans | 21.6 /100 | #197 | Fair 26.3% |
| Venezuelans | 21.5 /100 | #198 | Fair 26.3% |
| Dutch West Indians | 21.0 /100 | #199 | Fair 26.3% |
| Delaware | 20.9 /100 | #200 | Fair 26.3% |
| Immigrants | Syria | 19.3 /100 | #201 | Poor 26.4% |
Demographics Similar to Immigrants from Latvia by Wage/Income Gap
In terms of wage/income gap, the demographic groups most similar to Immigrants from Latvia are Immigrants from Poland (26.7%, a difference of 0.010%), Immigrants from Saudi Arabia (26.7%, a difference of 0.040%), Brazilian (26.7%, a difference of 0.070%), Immigrants from Spain (26.8%, a difference of 0.070%), and Bolivian (26.8%, a difference of 0.11%).
| Demographics | Rating | Rank | Wage/Income Gap |
| Immigrants | Iraq | 10.3 /100 | #213 | Poor 26.7% |
| Immigrants | China | 10.3 /100 | #214 | Poor 26.7% |
| Yugoslavians | 9.7 /100 | #215 | Tragic 26.7% |
| Immigrants | Portugal | 9.5 /100 | #216 | Tragic 26.7% |
| Brazilians | 9.2 /100 | #217 | Tragic 26.7% |
| Immigrants | Saudi Arabia | 9.1 /100 | #218 | Tragic 26.7% |
| Immigrants | Poland | 8.9 /100 | #219 | Tragic 26.7% |
| Immigrants | Latvia | 8.9 /100 | #220 | Tragic 26.7% |
| Immigrants | Spain | 8.5 /100 | #221 | Tragic 26.8% |
| Bolivians | 8.3 /100 | #222 | Tragic 26.8% |
| Jordanians | 8.0 /100 | #223 | Tragic 26.8% |
| Immigrants | Argentina | 7.2 /100 | #224 | Tragic 26.8% |
| Immigrants | Ireland | 6.5 /100 | #225 | Tragic 26.9% |
| Asians | 5.9 /100 | #226 | Tragic 26.9% |
| Spaniards | 5.6 /100 | #227 | Tragic 27.0% |