Immigrants vs Immigrants from Latvia Female Unemployment
COMPARE
Immigrants
Immigrants from Latvia
Female Unemployment
Female Unemployment Comparison
Immigrants
Immigrants from Latvia
5.7%
FEMALE UNEMPLOYMENT
0.6/ 100
METRIC RATING
254th/ 347
METRIC RANK
5.1%
FEMALE UNEMPLOYMENT
84.6/ 100
METRIC RATING
135th/ 347
METRIC RANK
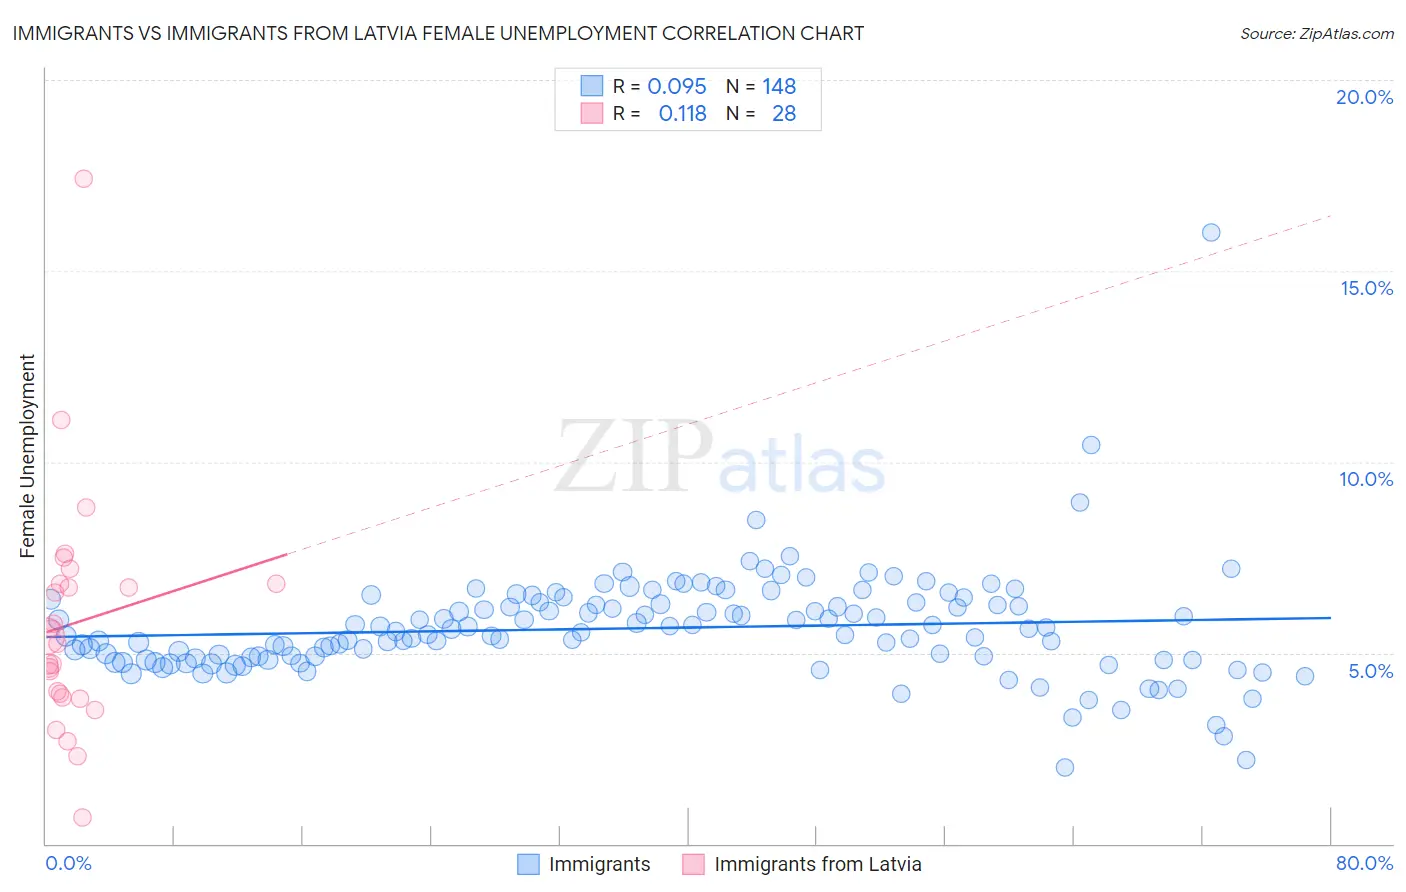
Immigrants vs Immigrants from Latvia Female Unemployment Correlation Chart
The statistical analysis conducted on geographies consisting of 563,480,166 people shows a slight positive correlation between the proportion of Immigrants and unemploymnet rate among females in the United States with a correlation coefficient (R) of 0.095 and weighted average of 5.7%. Similarly, the statistical analysis conducted on geographies consisting of 113,613,116 people shows a poor positive correlation between the proportion of Immigrants from Latvia and unemploymnet rate among females in the United States with a correlation coefficient (R) of 0.118 and weighted average of 5.1%, a difference of 10.5%.
Female Unemployment Correlation Summary
| Measurement | Immigrants | Immigrants from Latvia |
| Minimum | 2.0% | 0.70% |
| Maximum | 16.0% | 17.4% |
| Range | 14.0% | 16.7% |
| Mean | 5.6% | 5.8% |
| Median | 5.5% | 5.3% |
| Interquartile 25% (IQ1) | 4.8% | 3.9% |
| Interquartile 75% (IQ3) | 6.3% | 6.8% |
| Interquartile Range (IQR) | 1.4% | 2.9% |
| Standard Deviation (Sample) | 1.4% | 3.1% |
| Standard Deviation (Population) | 1.4% | 3.1% |
Similar Demographics by Female Unemployment
Demographics Similar to Immigrants by Female Unemployment
In terms of female unemployment, the demographic groups most similar to Immigrants are Immigrants from Sierra Leone (5.7%, a difference of 0.0%), Immigrants from Cameroon (5.7%, a difference of 0.040%), Cajun (5.7%, a difference of 0.15%), Assyrian/Chaldean/Syriac (5.6%, a difference of 0.34%), and Immigrants from Syria (5.6%, a difference of 0.41%).
| Demographics | Rating | Rank | Female Unemployment |
| Immigrants | Western Asia | 1.1 /100 | #247 | Tragic 5.6% |
| Cree | 1.0 /100 | #248 | Tragic 5.6% |
| Immigrants | Uzbekistan | 1.0 /100 | #249 | Tragic 5.6% |
| Immigrants | Syria | 0.8 /100 | #250 | Tragic 5.6% |
| Assyrians/Chaldeans/Syriacs | 0.8 /100 | #251 | Tragic 5.6% |
| Cajuns | 0.7 /100 | #252 | Tragic 5.7% |
| Immigrants | Sierra Leone | 0.6 /100 | #253 | Tragic 5.7% |
| Immigrants | Immigrants | 0.6 /100 | #254 | Tragic 5.7% |
| Immigrants | Cameroon | 0.6 /100 | #255 | Tragic 5.7% |
| Sub-Saharan Africans | 0.4 /100 | #256 | Tragic 5.7% |
| Dutch West Indians | 0.3 /100 | #257 | Tragic 5.7% |
| Immigrants | Portugal | 0.2 /100 | #258 | Tragic 5.8% |
| Immigrants | Fiji | 0.2 /100 | #259 | Tragic 5.8% |
| Nigerians | 0.2 /100 | #260 | Tragic 5.8% |
| Kiowa | 0.1 /100 | #261 | Tragic 5.8% |
Demographics Similar to Immigrants from Latvia by Female Unemployment
In terms of female unemployment, the demographic groups most similar to Immigrants from Latvia are Immigrants from Eritrea (5.1%, a difference of 0.0%), Immigrants from Hong Kong (5.1%, a difference of 0.030%), Immigrants from Sri Lanka (5.1%, a difference of 0.050%), Indian (Asian) (5.1%, a difference of 0.050%), and Pakistani (5.1%, a difference of 0.090%).
| Demographics | Rating | Rank | Female Unemployment |
| Chileans | 85.8 /100 | #128 | Excellent 5.1% |
| Ethiopians | 85.7 /100 | #129 | Excellent 5.1% |
| Maltese | 85.5 /100 | #130 | Excellent 5.1% |
| Immigrants | Ethiopia | 85.4 /100 | #131 | Excellent 5.1% |
| Immigrants | Sri Lanka | 85.0 /100 | #132 | Excellent 5.1% |
| Immigrants | Hong Kong | 84.8 /100 | #133 | Excellent 5.1% |
| Immigrants | Eritrea | 84.6 /100 | #134 | Excellent 5.1% |
| Immigrants | Latvia | 84.6 /100 | #135 | Excellent 5.1% |
| Indians (Asian) | 84.2 /100 | #136 | Excellent 5.1% |
| Pakistanis | 83.8 /100 | #137 | Excellent 5.1% |
| Chickasaw | 83.2 /100 | #138 | Excellent 5.1% |
| Immigrants | Eastern Asia | 83.0 /100 | #139 | Excellent 5.1% |
| Immigrants | France | 82.7 /100 | #140 | Excellent 5.1% |
| Immigrants | Eastern Europe | 81.5 /100 | #141 | Excellent 5.1% |
| Palestinians | 80.8 /100 | #142 | Excellent 5.1% |