Polish vs Immigrants from Latvia Wage/Income Gap
COMPARE
Polish
Immigrants from Latvia
Wage/Income Gap
Wage/Income Gap Comparison
Poles
Immigrants from Latvia
28.5%
WAGE/INCOME GAP
0.1/ 100
METRIC RATING
308th/ 347
METRIC RANK
26.7%
WAGE/INCOME GAP
8.9/ 100
METRIC RATING
220th/ 347
METRIC RANK
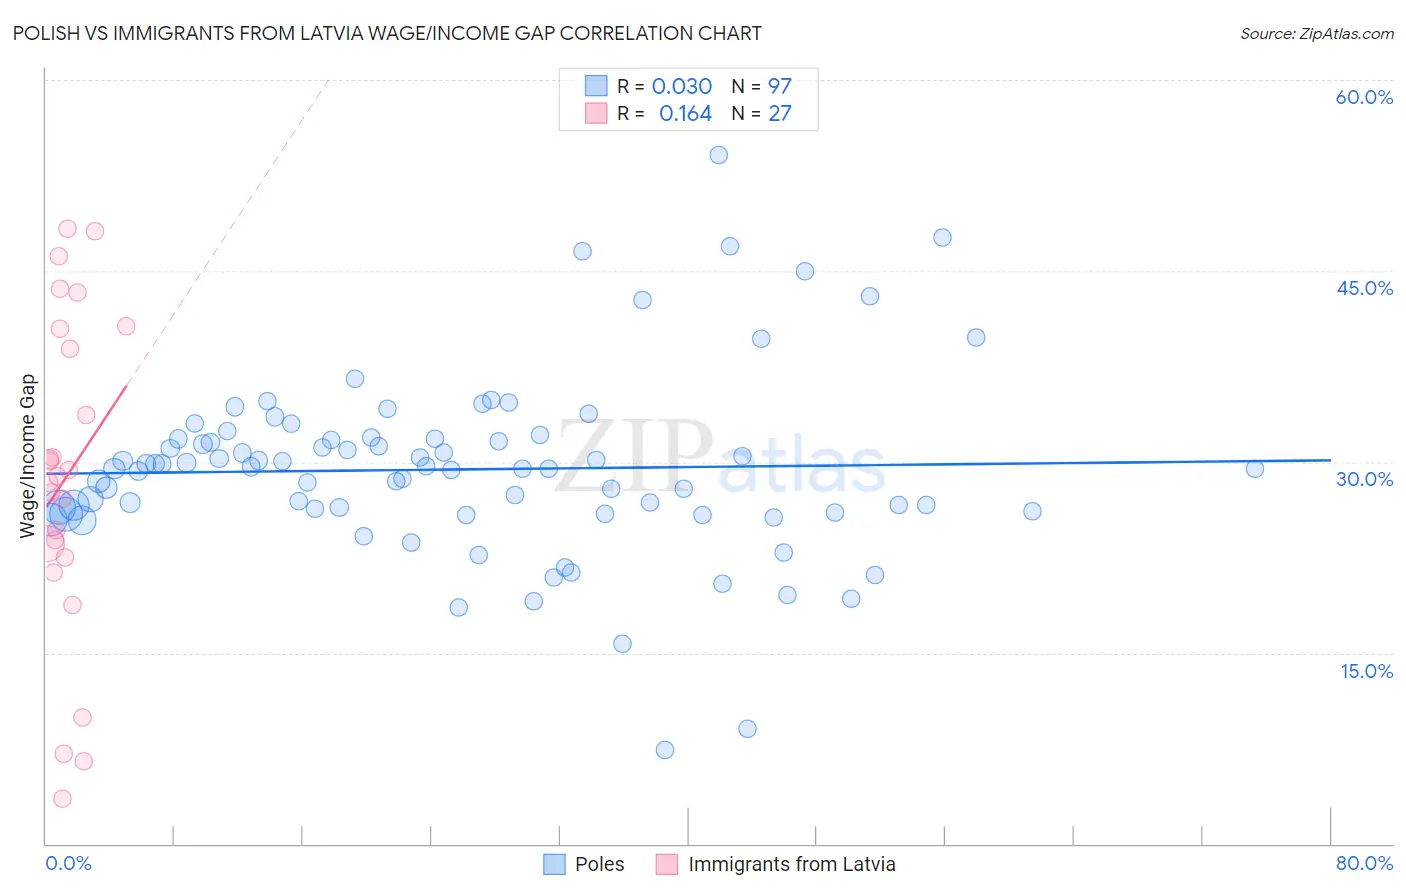
Polish vs Immigrants from Latvia Wage/Income Gap Correlation Chart
The statistical analysis conducted on geographies consisting of 558,332,968 people shows no correlation between the proportion of Poles and wage/income gap percentage in the United States with a correlation coefficient (R) of 0.030 and weighted average of 28.5%. Similarly, the statistical analysis conducted on geographies consisting of 113,720,883 people shows a poor positive correlation between the proportion of Immigrants from Latvia and wage/income gap percentage in the United States with a correlation coefficient (R) of 0.164 and weighted average of 26.7%, a difference of 6.7%.
Wage/Income Gap Correlation Summary
| Measurement | Polish | Immigrants from Latvia |
| Minimum | 7.4% | 3.5% |
| Maximum | 54.1% | 48.4% |
| Range | 46.7% | 44.8% |
| Mean | 29.4% | 28.8% |
| Median | 29.5% | 28.9% |
| Interquartile 25% (IQ1) | 26.1% | 22.5% |
| Interquartile 75% (IQ3) | 31.8% | 40.4% |
| Interquartile Range (IQR) | 5.7% | 18.0% |
| Standard Deviation (Sample) | 7.2% | 12.6% |
| Standard Deviation (Population) | 7.1% | 12.4% |
Similar Demographics by Wage/Income Gap
Demographics Similar to Poles by Wage/Income Gap
In terms of wage/income gap, the demographic groups most similar to Poles are Immigrants from Denmark (28.5%, a difference of 0.070%), White/Caucasian (28.5%, a difference of 0.080%), Macedonian (28.6%, a difference of 0.090%), Immigrants from South Africa (28.5%, a difference of 0.13%), and Immigrants from Netherlands (28.5%, a difference of 0.14%).
| Demographics | Rating | Rank | Wage/Income Gap |
| Immigrants | Canada | 0.2 /100 | #301 | Tragic 28.5% |
| Scotch-Irish | 0.2 /100 | #302 | Tragic 28.5% |
| Irish | 0.2 /100 | #303 | Tragic 28.5% |
| Immigrants | Netherlands | 0.2 /100 | #304 | Tragic 28.5% |
| Immigrants | South Africa | 0.1 /100 | #305 | Tragic 28.5% |
| Whites/Caucasians | 0.1 /100 | #306 | Tragic 28.5% |
| Immigrants | Denmark | 0.1 /100 | #307 | Tragic 28.5% |
| Poles | 0.1 /100 | #308 | Tragic 28.5% |
| Macedonians | 0.1 /100 | #309 | Tragic 28.6% |
| Finns | 0.1 /100 | #310 | Tragic 28.6% |
| Immigrants | Lithuania | 0.1 /100 | #311 | Tragic 28.6% |
| Eastern Europeans | 0.1 /100 | #312 | Tragic 28.6% |
| French | 0.1 /100 | #313 | Tragic 28.7% |
| Immigrants | Scotland | 0.1 /100 | #314 | Tragic 28.7% |
| Maltese | 0.1 /100 | #315 | Tragic 28.7% |
Demographics Similar to Immigrants from Latvia by Wage/Income Gap
In terms of wage/income gap, the demographic groups most similar to Immigrants from Latvia are Immigrants from Poland (26.7%, a difference of 0.010%), Immigrants from Saudi Arabia (26.7%, a difference of 0.040%), Brazilian (26.7%, a difference of 0.070%), Immigrants from Spain (26.8%, a difference of 0.070%), and Bolivian (26.8%, a difference of 0.11%).
| Demographics | Rating | Rank | Wage/Income Gap |
| Immigrants | Iraq | 10.3 /100 | #213 | Poor 26.7% |
| Immigrants | China | 10.3 /100 | #214 | Poor 26.7% |
| Yugoslavians | 9.7 /100 | #215 | Tragic 26.7% |
| Immigrants | Portugal | 9.5 /100 | #216 | Tragic 26.7% |
| Brazilians | 9.2 /100 | #217 | Tragic 26.7% |
| Immigrants | Saudi Arabia | 9.1 /100 | #218 | Tragic 26.7% |
| Immigrants | Poland | 8.9 /100 | #219 | Tragic 26.7% |
| Immigrants | Latvia | 8.9 /100 | #220 | Tragic 26.7% |
| Immigrants | Spain | 8.5 /100 | #221 | Tragic 26.8% |
| Bolivians | 8.3 /100 | #222 | Tragic 26.8% |
| Jordanians | 8.0 /100 | #223 | Tragic 26.8% |
| Immigrants | Argentina | 7.2 /100 | #224 | Tragic 26.8% |
| Immigrants | Ireland | 6.5 /100 | #225 | Tragic 26.9% |
| Asians | 5.9 /100 | #226 | Tragic 26.9% |
| Spaniards | 5.6 /100 | #227 | Tragic 27.0% |