Haitian vs Immigrants from Bahamas Median Earnings
COMPARE
Haitian
Immigrants from Bahamas
Median Earnings
Median Earnings Comparison
Haitians
Immigrants from Bahamas
$40,918
MEDIAN EARNINGS
0.0/ 100
METRIC RATING
303rd/ 347
METRIC RANK
$39,861
MEDIAN EARNINGS
0.0/ 100
METRIC RATING
320th/ 347
METRIC RANK
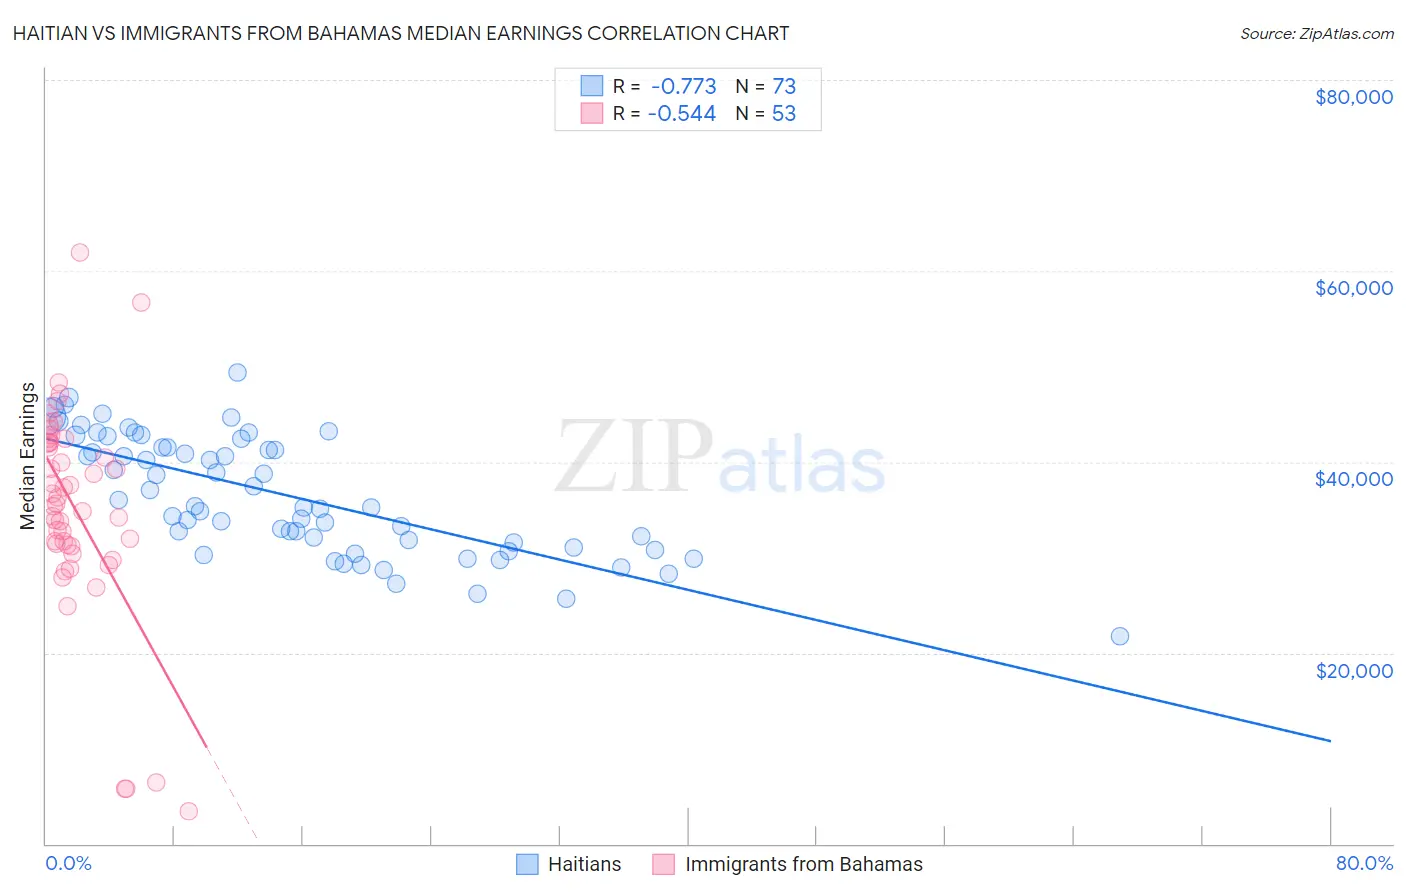
Haitian vs Immigrants from Bahamas Median Earnings Correlation Chart
The statistical analysis conducted on geographies consisting of 288,009,020 people shows a strong negative correlation between the proportion of Haitians and median earnings in the United States with a correlation coefficient (R) of -0.773 and weighted average of $40,918. Similarly, the statistical analysis conducted on geographies consisting of 104,655,250 people shows a substantial negative correlation between the proportion of Immigrants from Bahamas and median earnings in the United States with a correlation coefficient (R) of -0.544 and weighted average of $39,861, a difference of 2.6%.
Median Earnings Correlation Summary
| Measurement | Haitian | Immigrants from Bahamas |
| Minimum | $21,741 | $3,467 |
| Maximum | $49,370 | $61,875 |
| Range | $27,629 | $58,408 |
| Mean | $36,539 | $35,101 |
| Median | $35,319 | $35,644 |
| Interquartile 25% (IQ1) | $31,314 | $31,209 |
| Interquartile 75% (IQ3) | $41,959 | $42,043 |
| Interquartile Range (IQR) | $10,645 | $10,834 |
| Standard Deviation (Sample) | $6,179 | $11,156 |
| Standard Deviation (Population) | $6,136 | $11,051 |
Demographics Similar to Haitians and Immigrants from Bahamas by Median Earnings
In terms of median earnings, the demographic groups most similar to Haitians are Shoshone ($40,932, a difference of 0.030%), Immigrants from Guatemala ($40,851, a difference of 0.16%), Immigrants from Latin America ($41,049, a difference of 0.32%), Chickasaw ($40,672, a difference of 0.60%), and Yaqui ($40,647, a difference of 0.67%). Similarly, the demographic groups most similar to Immigrants from Bahamas are Mexican ($39,834, a difference of 0.070%), Black/African American ($40,085, a difference of 0.56%), Dutch West Indian ($40,107, a difference of 0.62%), Fijian ($40,193, a difference of 0.83%), and Immigrants from Honduras ($40,195, a difference of 0.84%).
| Demographics | Rating | Rank | Median Earnings |
| Immigrants | Latin America | 0.1 /100 | #301 | Tragic $41,049 |
| Shoshone | 0.0 /100 | #302 | Tragic $40,932 |
| Haitians | 0.0 /100 | #303 | Tragic $40,918 |
| Immigrants | Guatemala | 0.0 /100 | #304 | Tragic $40,851 |
| Chickasaw | 0.0 /100 | #305 | Tragic $40,672 |
| Yaqui | 0.0 /100 | #306 | Tragic $40,647 |
| Hondurans | 0.0 /100 | #307 | Tragic $40,638 |
| Cubans | 0.0 /100 | #308 | Tragic $40,619 |
| Immigrants | Haiti | 0.0 /100 | #309 | Tragic $40,550 |
| Apache | 0.0 /100 | #310 | Tragic $40,388 |
| Hispanics or Latinos | 0.0 /100 | #311 | Tragic $40,288 |
| Chippewa | 0.0 /100 | #312 | Tragic $40,287 |
| Choctaw | 0.0 /100 | #313 | Tragic $40,270 |
| Cheyenne | 0.0 /100 | #314 | Tragic $40,233 |
| Seminole | 0.0 /100 | #315 | Tragic $40,233 |
| Immigrants | Honduras | 0.0 /100 | #316 | Tragic $40,195 |
| Fijians | 0.0 /100 | #317 | Tragic $40,193 |
| Dutch West Indians | 0.0 /100 | #318 | Tragic $40,107 |
| Blacks/African Americans | 0.0 /100 | #319 | Tragic $40,085 |
| Immigrants | Bahamas | 0.0 /100 | #320 | Tragic $39,861 |
| Mexicans | 0.0 /100 | #321 | Tragic $39,834 |