Immigrants from Congo vs Immigrants from Bahamas Median Earnings
COMPARE
Immigrants from Congo
Immigrants from Bahamas
Median Earnings
Median Earnings Comparison
Immigrants from Congo
Immigrants from Bahamas
$39,169
MEDIAN EARNINGS
0.0/ 100
METRIC RATING
330th/ 347
METRIC RANK
$39,861
MEDIAN EARNINGS
0.0/ 100
METRIC RATING
320th/ 347
METRIC RANK
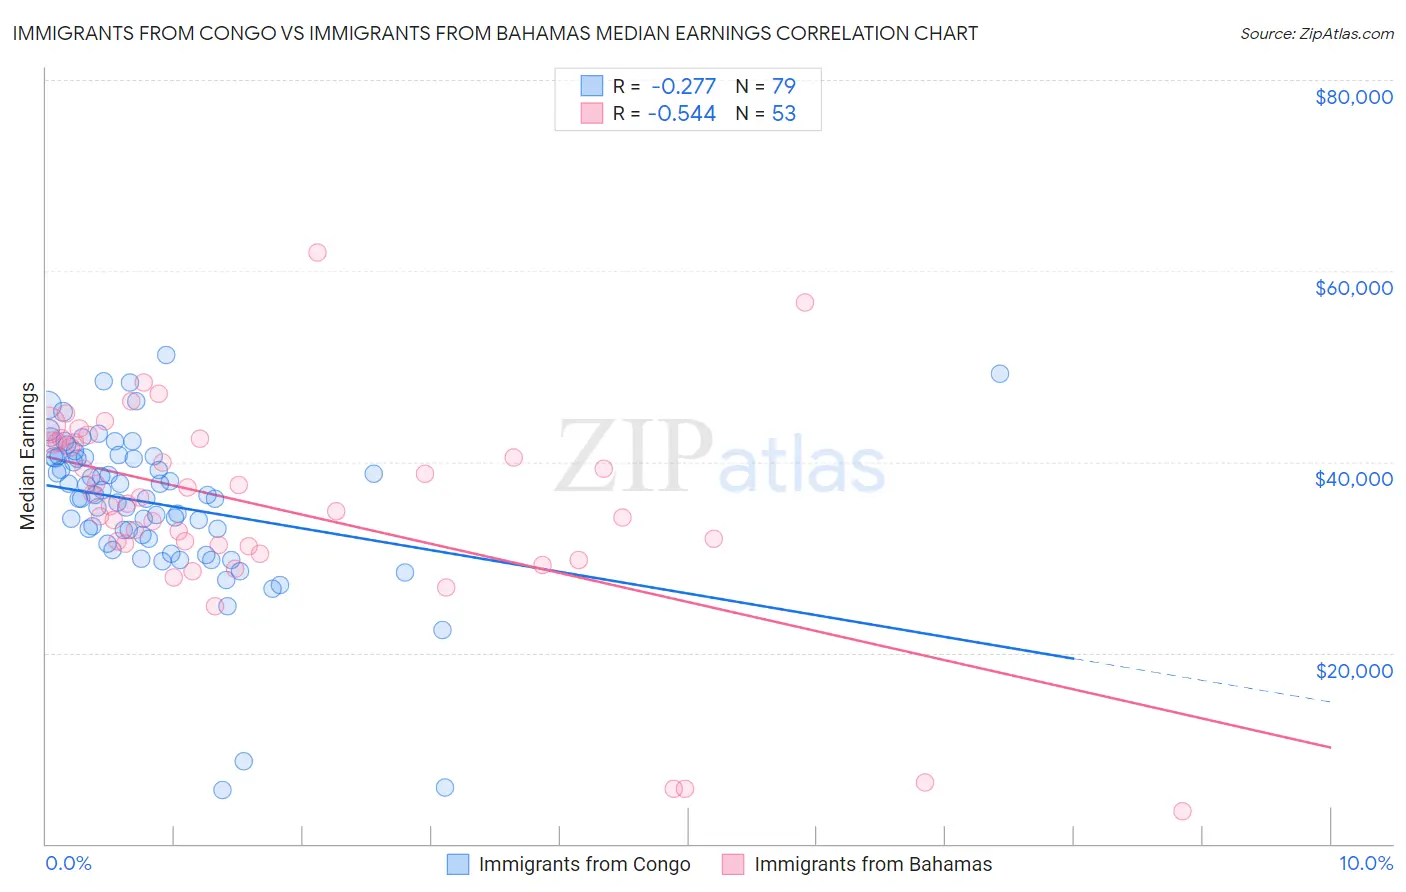
Immigrants from Congo vs Immigrants from Bahamas Median Earnings Correlation Chart
The statistical analysis conducted on geographies consisting of 92,120,169 people shows a weak negative correlation between the proportion of Immigrants from Congo and median earnings in the United States with a correlation coefficient (R) of -0.277 and weighted average of $39,169. Similarly, the statistical analysis conducted on geographies consisting of 104,655,250 people shows a substantial negative correlation between the proportion of Immigrants from Bahamas and median earnings in the United States with a correlation coefficient (R) of -0.544 and weighted average of $39,861, a difference of 1.8%.
Median Earnings Correlation Summary
| Measurement | Immigrants from Congo | Immigrants from Bahamas |
| Minimum | $5,625 | $3,467 |
| Maximum | $51,158 | $61,875 |
| Range | $45,533 | $58,408 |
| Mean | $35,599 | $35,101 |
| Median | $36,543 | $35,644 |
| Interquartile 25% (IQ1) | $31,963 | $31,209 |
| Interquartile 75% (IQ3) | $40,520 | $42,043 |
| Interquartile Range (IQR) | $8,557 | $10,834 |
| Standard Deviation (Sample) | $8,202 | $11,156 |
| Standard Deviation (Population) | $8,150 | $11,051 |
Demographics Similar to Immigrants from Congo and Immigrants from Bahamas by Median Earnings
In terms of median earnings, the demographic groups most similar to Immigrants from Congo are Immigrants from Mexico ($39,114, a difference of 0.14%), Kiowa ($39,232, a difference of 0.16%), Yakama ($39,107, a difference of 0.16%), Houma ($38,949, a difference of 0.57%), and Spanish American Indian ($38,907, a difference of 0.67%). Similarly, the demographic groups most similar to Immigrants from Bahamas are Mexican ($39,834, a difference of 0.070%), Immigrants from Central America ($39,762, a difference of 0.25%), Bahamian ($39,735, a difference of 0.32%), Ottawa ($39,721, a difference of 0.35%), and Creek ($39,648, a difference of 0.54%).
| Demographics | Rating | Rank | Median Earnings |
| Seminole | 0.0 /100 | #315 | Tragic $40,233 |
| Immigrants | Honduras | 0.0 /100 | #316 | Tragic $40,195 |
| Fijians | 0.0 /100 | #317 | Tragic $40,193 |
| Dutch West Indians | 0.0 /100 | #318 | Tragic $40,107 |
| Blacks/African Americans | 0.0 /100 | #319 | Tragic $40,085 |
| Immigrants | Bahamas | 0.0 /100 | #320 | Tragic $39,861 |
| Mexicans | 0.0 /100 | #321 | Tragic $39,834 |
| Immigrants | Central America | 0.0 /100 | #322 | Tragic $39,762 |
| Bahamians | 0.0 /100 | #323 | Tragic $39,735 |
| Ottawa | 0.0 /100 | #324 | Tragic $39,721 |
| Creek | 0.0 /100 | #325 | Tragic $39,648 |
| Immigrants | Yemen | 0.0 /100 | #326 | Tragic $39,540 |
| Yuman | 0.0 /100 | #327 | Tragic $39,523 |
| Sioux | 0.0 /100 | #328 | Tragic $39,448 |
| Kiowa | 0.0 /100 | #329 | Tragic $39,232 |
| Immigrants | Congo | 0.0 /100 | #330 | Tragic $39,169 |
| Immigrants | Mexico | 0.0 /100 | #331 | Tragic $39,114 |
| Yakama | 0.0 /100 | #332 | Tragic $39,107 |
| Houma | 0.0 /100 | #333 | Tragic $38,949 |
| Spanish American Indians | 0.0 /100 | #334 | Tragic $38,907 |
| Natives/Alaskans | 0.0 /100 | #335 | Tragic $38,896 |