Austrian vs Immigrants from Bahamas Median Earnings
COMPARE
Austrian
Immigrants from Bahamas
Median Earnings
Median Earnings Comparison
Austrians
Immigrants from Bahamas
$49,501
MEDIAN EARNINGS
98.7/ 100
METRIC RATING
103rd/ 347
METRIC RANK
$39,861
MEDIAN EARNINGS
0.0/ 100
METRIC RATING
320th/ 347
METRIC RANK
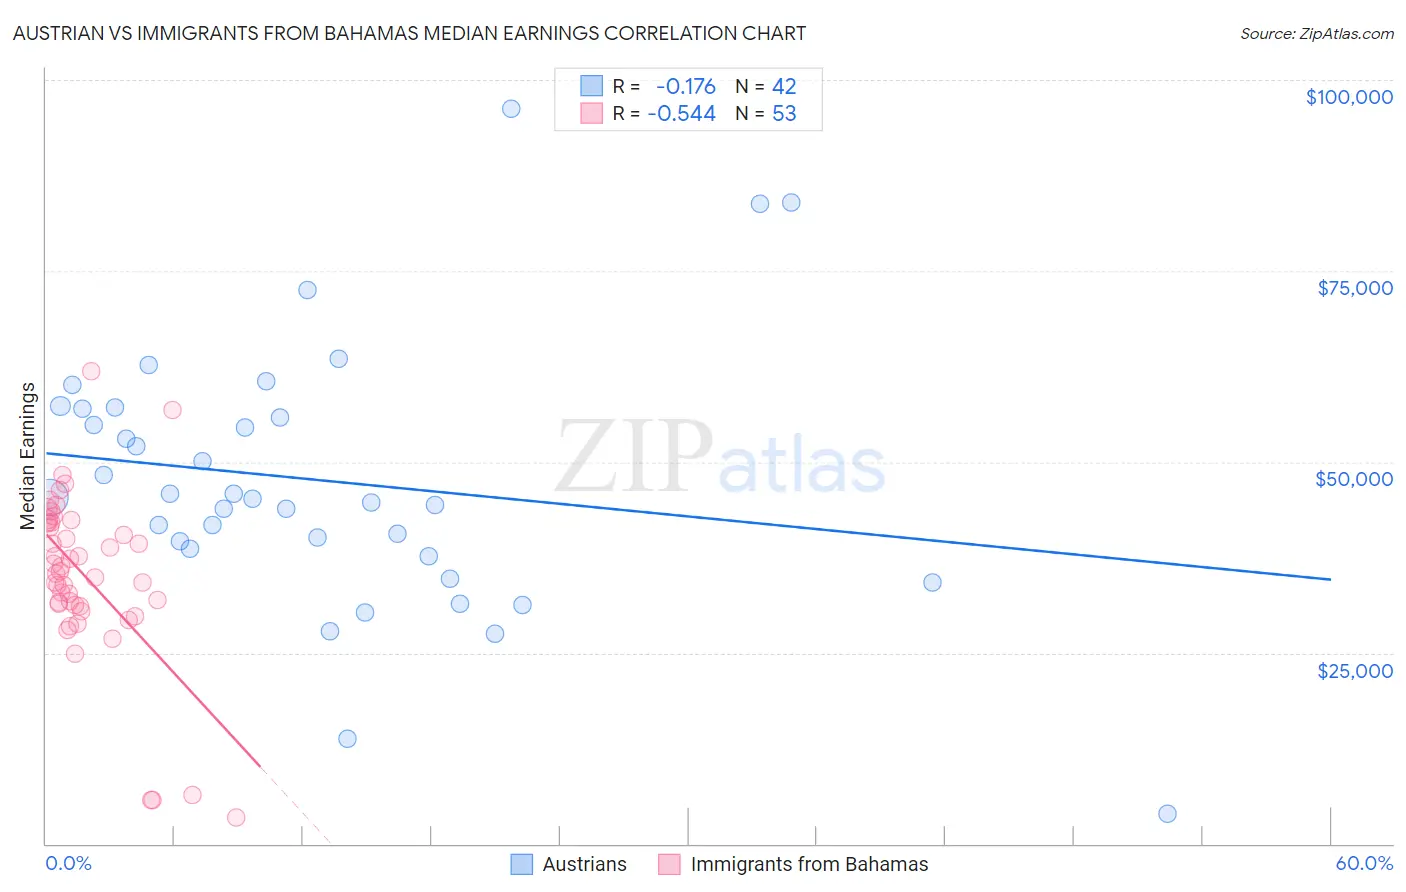
Austrian vs Immigrants from Bahamas Median Earnings Correlation Chart
The statistical analysis conducted on geographies consisting of 452,042,983 people shows a poor negative correlation between the proportion of Austrians and median earnings in the United States with a correlation coefficient (R) of -0.176 and weighted average of $49,501. Similarly, the statistical analysis conducted on geographies consisting of 104,655,250 people shows a substantial negative correlation between the proportion of Immigrants from Bahamas and median earnings in the United States with a correlation coefficient (R) of -0.544 and weighted average of $39,861, a difference of 24.2%.
Median Earnings Correlation Summary
| Measurement | Austrian | Immigrants from Bahamas |
| Minimum | $3,902 | $3,467 |
| Maximum | $96,250 | $61,875 |
| Range | $92,348 | $58,408 |
| Mean | $47,542 | $35,101 |
| Median | $45,255 | $35,644 |
| Interquartile 25% (IQ1) | $38,609 | $31,209 |
| Interquartile 75% (IQ3) | $56,967 | $42,043 |
| Interquartile Range (IQR) | $18,358 | $10,834 |
| Standard Deviation (Sample) | $17,409 | $11,156 |
| Standard Deviation (Population) | $17,200 | $11,051 |
Similar Demographics by Median Earnings
Demographics Similar to Austrians by Median Earnings
In terms of median earnings, the demographic groups most similar to Austrians are Immigrants from Brazil ($49,463, a difference of 0.080%), Ethiopian ($49,572, a difference of 0.14%), Immigrants from Western Asia ($49,389, a difference of 0.23%), Immigrants from Albania ($49,377, a difference of 0.25%), and Immigrants from Poland ($49,633, a difference of 0.27%).
| Demographics | Rating | Rank | Median Earnings |
| Immigrants | Lebanon | 99.0 /100 | #96 | Exceptional $49,682 |
| Immigrants | North Macedonia | 98.9 /100 | #97 | Exceptional $49,658 |
| Immigrants | Northern Africa | 98.9 /100 | #98 | Exceptional $49,648 |
| Immigrants | Afghanistan | 98.9 /100 | #99 | Exceptional $49,645 |
| Immigrants | Poland | 98.9 /100 | #100 | Exceptional $49,633 |
| Jordanians | 98.9 /100 | #101 | Exceptional $49,632 |
| Ethiopians | 98.8 /100 | #102 | Exceptional $49,572 |
| Austrians | 98.7 /100 | #103 | Exceptional $49,501 |
| Immigrants | Brazil | 98.6 /100 | #104 | Exceptional $49,463 |
| Immigrants | Western Asia | 98.4 /100 | #105 | Exceptional $49,389 |
| Immigrants | Albania | 98.4 /100 | #106 | Exceptional $49,377 |
| Immigrants | Morocco | 98.4 /100 | #107 | Exceptional $49,368 |
| Palestinians | 98.0 /100 | #108 | Exceptional $49,209 |
| Syrians | 97.1 /100 | #109 | Exceptional $48,934 |
| Immigrants | Ethiopia | 97.1 /100 | #110 | Exceptional $48,924 |
Demographics Similar to Immigrants from Bahamas by Median Earnings
In terms of median earnings, the demographic groups most similar to Immigrants from Bahamas are Mexican ($39,834, a difference of 0.070%), Immigrants from Central America ($39,762, a difference of 0.25%), Bahamian ($39,735, a difference of 0.32%), Ottawa ($39,721, a difference of 0.35%), and Creek ($39,648, a difference of 0.54%).
| Demographics | Rating | Rank | Median Earnings |
| Choctaw | 0.0 /100 | #313 | Tragic $40,270 |
| Cheyenne | 0.0 /100 | #314 | Tragic $40,233 |
| Seminole | 0.0 /100 | #315 | Tragic $40,233 |
| Immigrants | Honduras | 0.0 /100 | #316 | Tragic $40,195 |
| Fijians | 0.0 /100 | #317 | Tragic $40,193 |
| Dutch West Indians | 0.0 /100 | #318 | Tragic $40,107 |
| Blacks/African Americans | 0.0 /100 | #319 | Tragic $40,085 |
| Immigrants | Bahamas | 0.0 /100 | #320 | Tragic $39,861 |
| Mexicans | 0.0 /100 | #321 | Tragic $39,834 |
| Immigrants | Central America | 0.0 /100 | #322 | Tragic $39,762 |
| Bahamians | 0.0 /100 | #323 | Tragic $39,735 |
| Ottawa | 0.0 /100 | #324 | Tragic $39,721 |
| Creek | 0.0 /100 | #325 | Tragic $39,648 |
| Immigrants | Yemen | 0.0 /100 | #326 | Tragic $39,540 |
| Yuman | 0.0 /100 | #327 | Tragic $39,523 |