Immigrants from Eastern Africa vs Immigrants from Bahamas Median Earnings
COMPARE
Immigrants from Eastern Africa
Immigrants from Bahamas
Median Earnings
Median Earnings Comparison
Immigrants from Eastern Africa
Immigrants from Bahamas
$46,969
MEDIAN EARNINGS
68.0/ 100
METRIC RATING
161st/ 347
METRIC RANK
$39,861
MEDIAN EARNINGS
0.0/ 100
METRIC RATING
320th/ 347
METRIC RANK
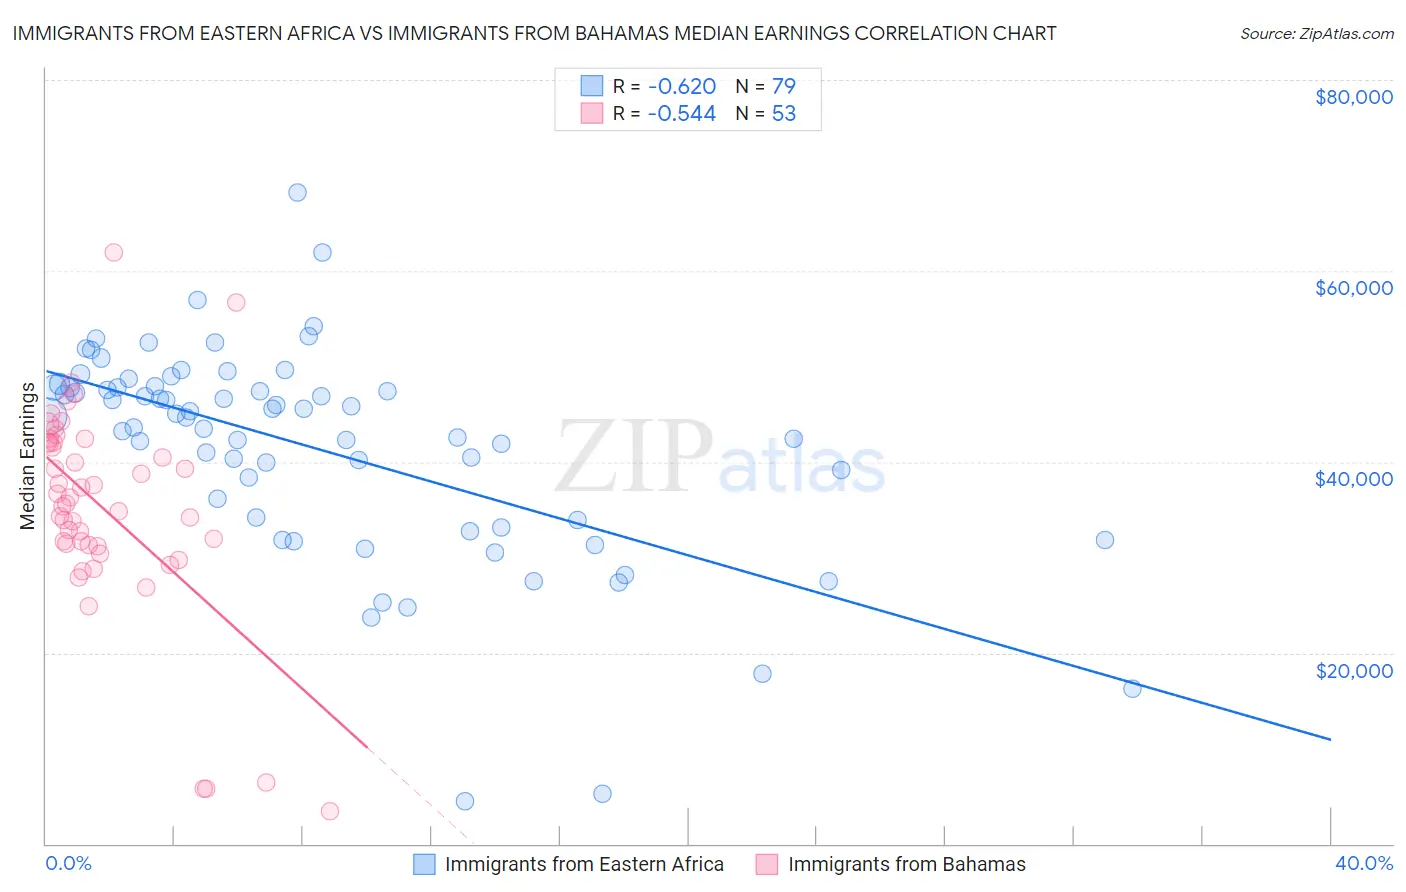
Immigrants from Eastern Africa vs Immigrants from Bahamas Median Earnings Correlation Chart
The statistical analysis conducted on geographies consisting of 355,152,385 people shows a significant negative correlation between the proportion of Immigrants from Eastern Africa and median earnings in the United States with a correlation coefficient (R) of -0.620 and weighted average of $46,969. Similarly, the statistical analysis conducted on geographies consisting of 104,655,250 people shows a substantial negative correlation between the proportion of Immigrants from Bahamas and median earnings in the United States with a correlation coefficient (R) of -0.544 and weighted average of $39,861, a difference of 17.8%.
Median Earnings Correlation Summary
| Measurement | Immigrants from Eastern Africa | Immigrants from Bahamas |
| Minimum | $4,426 | $3,467 |
| Maximum | $68,236 | $61,875 |
| Range | $63,810 | $58,408 |
| Mean | $41,397 | $35,101 |
| Median | $44,805 | $35,644 |
| Interquartile 25% (IQ1) | $33,958 | $31,209 |
| Interquartile 75% (IQ3) | $47,783 | $42,043 |
| Interquartile Range (IQR) | $13,825 | $10,834 |
| Standard Deviation (Sample) | $11,219 | $11,156 |
| Standard Deviation (Population) | $11,147 | $11,051 |
Similar Demographics by Median Earnings
Demographics Similar to Immigrants from Eastern Africa by Median Earnings
In terms of median earnings, the demographic groups most similar to Immigrants from Eastern Africa are South American Indian ($46,952, a difference of 0.040%), Alsatian ($47,023, a difference of 0.11%), Icelander ($46,916, a difference of 0.11%), Immigrants from Peru ($47,025, a difference of 0.12%), and Norwegian ($46,865, a difference of 0.22%).
| Demographics | Rating | Rank | Median Earnings |
| Immigrants | Portugal | 77.3 /100 | #154 | Good $47,304 |
| Immigrants | Vietnam | 76.7 /100 | #155 | Good $47,282 |
| Irish | 76.6 /100 | #156 | Good $47,276 |
| Czechs | 75.1 /100 | #157 | Good $47,221 |
| Slovaks | 71.7 /100 | #158 | Good $47,095 |
| Immigrants | Peru | 69.6 /100 | #159 | Good $47,025 |
| Alsatians | 69.6 /100 | #160 | Good $47,023 |
| Immigrants | Eastern Africa | 68.0 /100 | #161 | Good $46,969 |
| South American Indians | 67.4 /100 | #162 | Good $46,952 |
| Icelanders | 66.3 /100 | #163 | Good $46,916 |
| Norwegians | 64.7 /100 | #164 | Good $46,865 |
| South Americans | 62.7 /100 | #165 | Good $46,804 |
| Czechoslovakians | 57.8 /100 | #166 | Average $46,658 |
| Costa Ricans | 57.4 /100 | #167 | Average $46,645 |
| Immigrants | Africa | 54.6 /100 | #168 | Average $46,564 |
Demographics Similar to Immigrants from Bahamas by Median Earnings
In terms of median earnings, the demographic groups most similar to Immigrants from Bahamas are Mexican ($39,834, a difference of 0.070%), Immigrants from Central America ($39,762, a difference of 0.25%), Bahamian ($39,735, a difference of 0.32%), Ottawa ($39,721, a difference of 0.35%), and Creek ($39,648, a difference of 0.54%).
| Demographics | Rating | Rank | Median Earnings |
| Choctaw | 0.0 /100 | #313 | Tragic $40,270 |
| Cheyenne | 0.0 /100 | #314 | Tragic $40,233 |
| Seminole | 0.0 /100 | #315 | Tragic $40,233 |
| Immigrants | Honduras | 0.0 /100 | #316 | Tragic $40,195 |
| Fijians | 0.0 /100 | #317 | Tragic $40,193 |
| Dutch West Indians | 0.0 /100 | #318 | Tragic $40,107 |
| Blacks/African Americans | 0.0 /100 | #319 | Tragic $40,085 |
| Immigrants | Bahamas | 0.0 /100 | #320 | Tragic $39,861 |
| Mexicans | 0.0 /100 | #321 | Tragic $39,834 |
| Immigrants | Central America | 0.0 /100 | #322 | Tragic $39,762 |
| Bahamians | 0.0 /100 | #323 | Tragic $39,735 |
| Ottawa | 0.0 /100 | #324 | Tragic $39,721 |
| Creek | 0.0 /100 | #325 | Tragic $39,648 |
| Immigrants | Yemen | 0.0 /100 | #326 | Tragic $39,540 |
| Yuman | 0.0 /100 | #327 | Tragic $39,523 |