Immigrants from Western Asia vs Immigrants from Northern Africa Wage/Income Gap
COMPARE
Immigrants from Western Asia
Immigrants from Northern Africa
Wage/Income Gap
Wage/Income Gap Comparison
Immigrants from Western Asia
Immigrants from Northern Africa
26.3%
WAGE/INCOME GAP
21.7/ 100
METRIC RATING
196th/ 347
METRIC RANK
25.2%
WAGE/INCOME GAP
78.1/ 100
METRIC RATING
154th/ 347
METRIC RANK
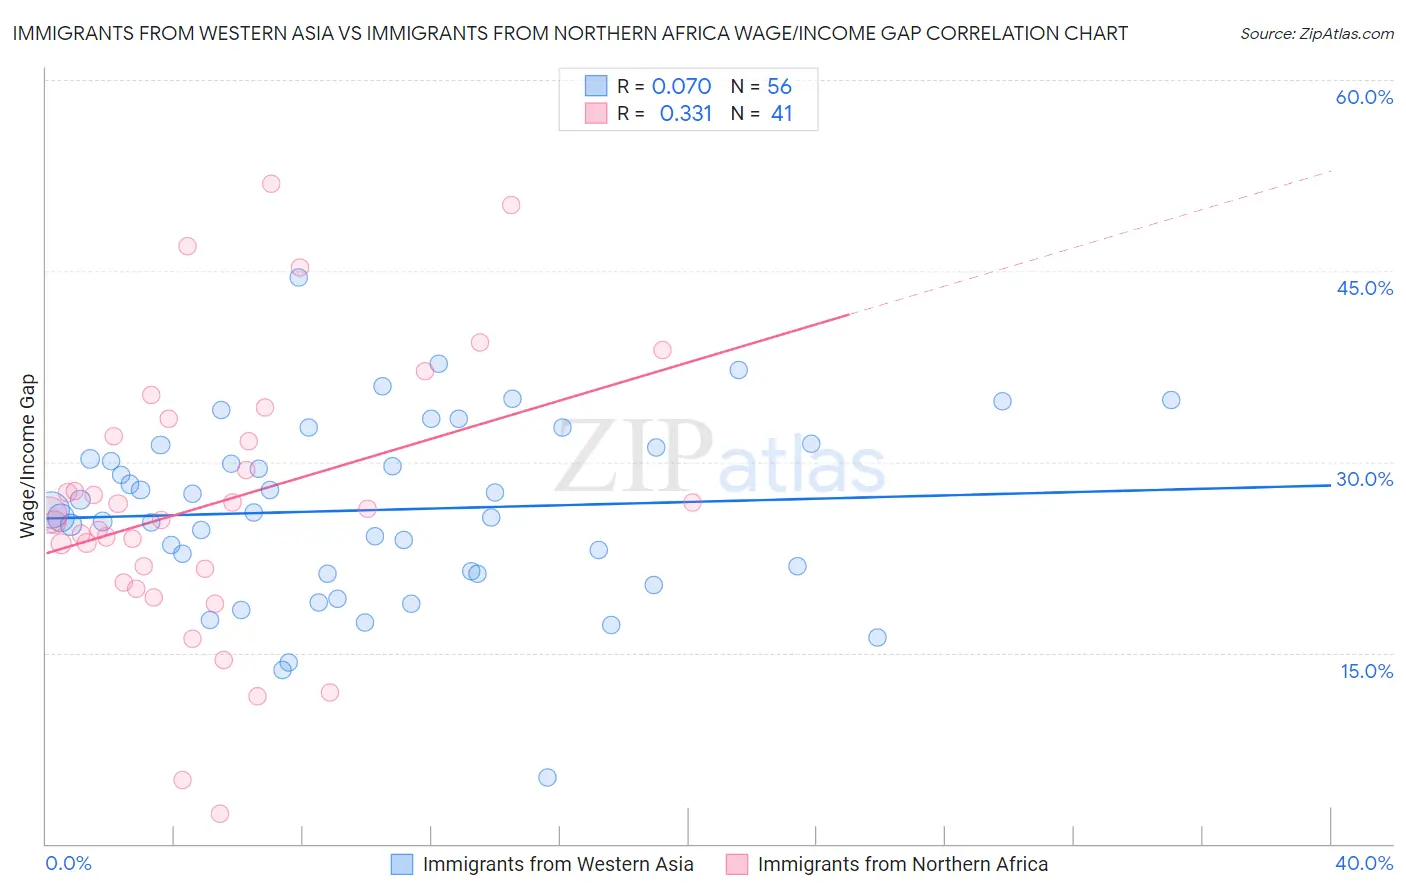
Immigrants from Western Asia vs Immigrants from Northern Africa Wage/Income Gap Correlation Chart
The statistical analysis conducted on geographies consisting of 404,196,693 people shows a slight positive correlation between the proportion of Immigrants from Western Asia and wage/income gap percentage in the United States with a correlation coefficient (R) of 0.070 and weighted average of 26.3%. Similarly, the statistical analysis conducted on geographies consisting of 321,071,721 people shows a mild positive correlation between the proportion of Immigrants from Northern Africa and wage/income gap percentage in the United States with a correlation coefficient (R) of 0.331 and weighted average of 25.2%, a difference of 4.3%.
Wage/Income Gap Correlation Summary
| Measurement | Immigrants from Western Asia | Immigrants from Northern Africa |
| Minimum | 5.2% | 2.3% |
| Maximum | 44.5% | 51.9% |
| Range | 39.3% | 49.5% |
| Mean | 26.2% | 26.8% |
| Median | 26.2% | 25.8% |
| Interquartile 25% (IQ1) | 21.3% | 21.1% |
| Interquartile 75% (IQ3) | 31.2% | 32.7% |
| Interquartile Range (IQR) | 9.9% | 11.6% |
| Standard Deviation (Sample) | 7.1% | 10.8% |
| Standard Deviation (Population) | 7.1% | 10.7% |
Similar Demographics by Wage/Income Gap
Demographics Similar to Immigrants from Western Asia by Wage/Income Gap
In terms of wage/income gap, the demographic groups most similar to Immigrants from Western Asia are Zimbabwean (26.3%, a difference of 0.010%), Venezuelan (26.3%, a difference of 0.020%), Immigrants from Malaysia (26.3%, a difference of 0.050%), Immigrants from Jordan (26.3%, a difference of 0.060%), and Chilean (26.3%, a difference of 0.060%).
| Demographics | Rating | Rank | Wage/Income Gap |
| Immigrants | Moldova | 26.6 /100 | #189 | Fair 26.2% |
| Immigrants | Croatia | 24.8 /100 | #190 | Fair 26.2% |
| Immigrants | Venezuela | 24.7 /100 | #191 | Fair 26.2% |
| Immigrants | Bulgaria | 22.5 /100 | #192 | Fair 26.3% |
| Immigrants | Jordan | 22.4 /100 | #193 | Fair 26.3% |
| Chileans | 22.3 /100 | #194 | Fair 26.3% |
| Immigrants | Malaysia | 22.2 /100 | #195 | Fair 26.3% |
| Immigrants | Western Asia | 21.7 /100 | #196 | Fair 26.3% |
| Zimbabweans | 21.6 /100 | #197 | Fair 26.3% |
| Venezuelans | 21.5 /100 | #198 | Fair 26.3% |
| Dutch West Indians | 21.0 /100 | #199 | Fair 26.3% |
| Delaware | 20.9 /100 | #200 | Fair 26.3% |
| Immigrants | Syria | 19.3 /100 | #201 | Poor 26.4% |
| Laotians | 19.2 /100 | #202 | Poor 26.4% |
| Immigrants | Eastern Europe | 19.2 /100 | #203 | Poor 26.4% |
Demographics Similar to Immigrants from Northern Africa by Wage/Income Gap
In terms of wage/income gap, the demographic groups most similar to Immigrants from Northern Africa are Blackfeet (25.2%, a difference of 0.010%), Immigrants from Vietnam (25.2%, a difference of 0.040%), Immigrants from Mexico (25.3%, a difference of 0.16%), Costa Rican (25.3%, a difference of 0.22%), and Uruguayan (25.2%, a difference of 0.33%).
| Demographics | Rating | Rank | Wage/Income Gap |
| Malaysians | 84.9 /100 | #147 | Excellent 25.0% |
| Iroquois | 83.9 /100 | #148 | Excellent 25.1% |
| Immigrants | Peru | 82.6 /100 | #149 | Excellent 25.1% |
| Immigrants | Immigrants | 82.3 /100 | #150 | Excellent 25.1% |
| Taiwanese | 81.6 /100 | #151 | Excellent 25.1% |
| Uruguayans | 81.3 /100 | #152 | Excellent 25.2% |
| Blackfeet | 78.1 /100 | #153 | Good 25.2% |
| Immigrants | Northern Africa | 78.1 /100 | #154 | Good 25.2% |
| Immigrants | Vietnam | 77.7 /100 | #155 | Good 25.2% |
| Immigrants | Mexico | 76.4 /100 | #156 | Good 25.3% |
| Costa Ricans | 75.8 /100 | #157 | Good 25.3% |
| Immigrants | Zimbabwe | 73.7 /100 | #158 | Good 25.3% |
| Puget Sound Salish | 73.0 /100 | #159 | Good 25.3% |
| French American Indians | 72.5 /100 | #160 | Good 25.4% |
| Albanians | 69.4 /100 | #161 | Good 25.4% |