Immigrants from Western Asia vs Lebanese Wage/Income Gap
COMPARE
Immigrants from Western Asia
Lebanese
Wage/Income Gap
Wage/Income Gap Comparison
Immigrants from Western Asia
Lebanese
26.3%
WAGE/INCOME GAP
21.7/ 100
METRIC RATING
196th/ 347
METRIC RANK
27.9%
WAGE/INCOME GAP
0.7/ 100
METRIC RATING
276th/ 347
METRIC RANK
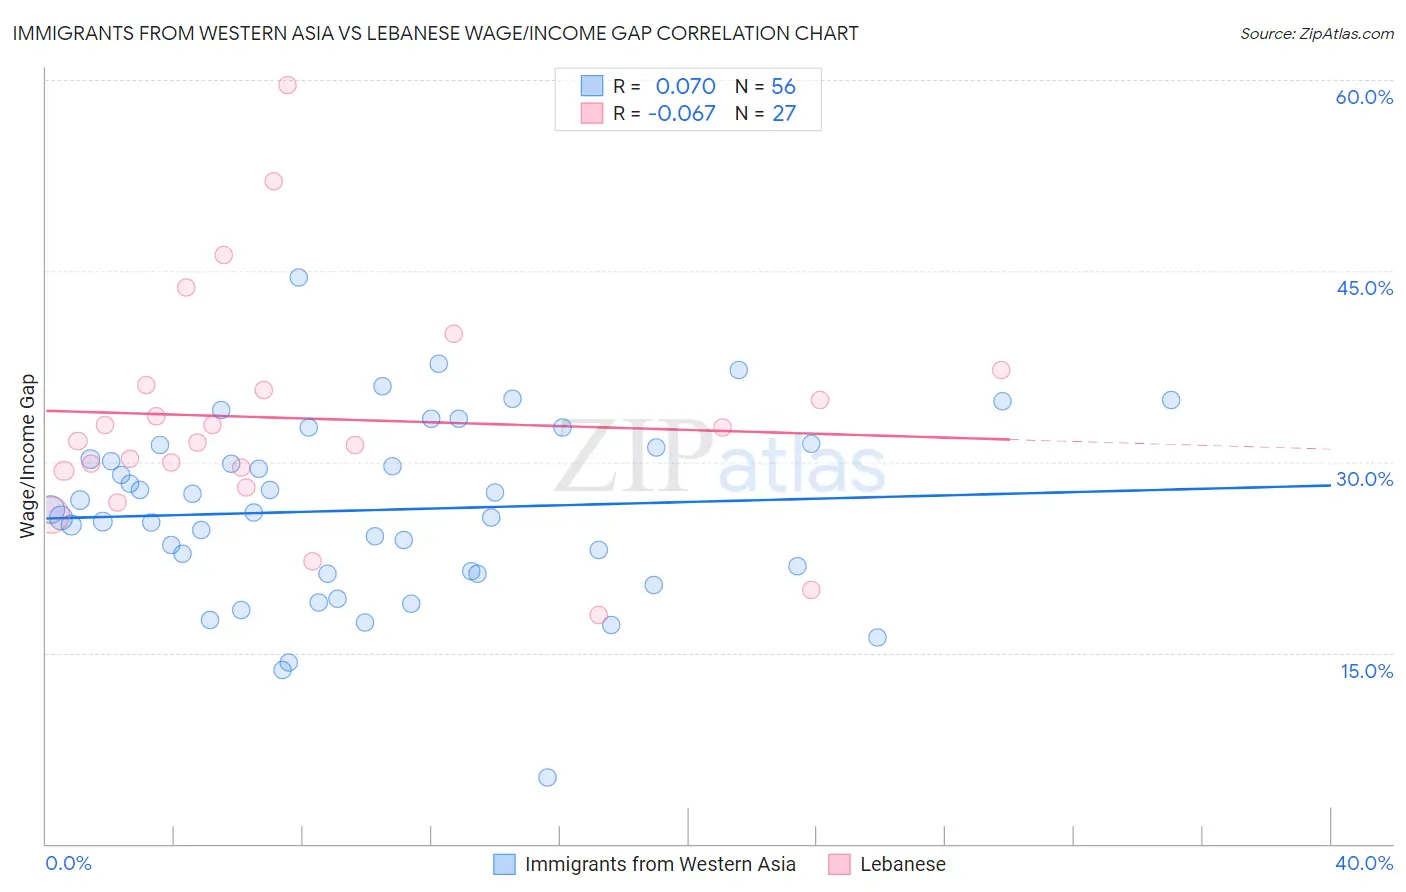
Immigrants from Western Asia vs Lebanese Wage/Income Gap Correlation Chart
The statistical analysis conducted on geographies consisting of 404,196,693 people shows a slight positive correlation between the proportion of Immigrants from Western Asia and wage/income gap percentage in the United States with a correlation coefficient (R) of 0.070 and weighted average of 26.3%. Similarly, the statistical analysis conducted on geographies consisting of 401,331,203 people shows a slight negative correlation between the proportion of Lebanese and wage/income gap percentage in the United States with a correlation coefficient (R) of -0.067 and weighted average of 27.9%, a difference of 5.9%.
Wage/Income Gap Correlation Summary
| Measurement | Immigrants from Western Asia | Lebanese |
| Minimum | 5.2% | 18.0% |
| Maximum | 44.5% | 59.6% |
| Range | 39.3% | 41.7% |
| Mean | 26.2% | 33.4% |
| Median | 26.2% | 31.7% |
| Interquartile 25% (IQ1) | 21.3% | 29.3% |
| Interquartile 75% (IQ3) | 31.2% | 36.0% |
| Interquartile Range (IQR) | 9.9% | 6.7% |
| Standard Deviation (Sample) | 7.1% | 9.1% |
| Standard Deviation (Population) | 7.1% | 8.9% |
Similar Demographics by Wage/Income Gap
Demographics Similar to Immigrants from Western Asia by Wage/Income Gap
In terms of wage/income gap, the demographic groups most similar to Immigrants from Western Asia are Zimbabwean (26.3%, a difference of 0.010%), Venezuelan (26.3%, a difference of 0.020%), Immigrants from Malaysia (26.3%, a difference of 0.050%), Immigrants from Jordan (26.3%, a difference of 0.060%), and Chilean (26.3%, a difference of 0.060%).
| Demographics | Rating | Rank | Wage/Income Gap |
| Immigrants | Moldova | 26.6 /100 | #189 | Fair 26.2% |
| Immigrants | Croatia | 24.8 /100 | #190 | Fair 26.2% |
| Immigrants | Venezuela | 24.7 /100 | #191 | Fair 26.2% |
| Immigrants | Bulgaria | 22.5 /100 | #192 | Fair 26.3% |
| Immigrants | Jordan | 22.4 /100 | #193 | Fair 26.3% |
| Chileans | 22.3 /100 | #194 | Fair 26.3% |
| Immigrants | Malaysia | 22.2 /100 | #195 | Fair 26.3% |
| Immigrants | Western Asia | 21.7 /100 | #196 | Fair 26.3% |
| Zimbabweans | 21.6 /100 | #197 | Fair 26.3% |
| Venezuelans | 21.5 /100 | #198 | Fair 26.3% |
| Dutch West Indians | 21.0 /100 | #199 | Fair 26.3% |
| Delaware | 20.9 /100 | #200 | Fair 26.3% |
| Immigrants | Syria | 19.3 /100 | #201 | Poor 26.4% |
| Laotians | 19.2 /100 | #202 | Poor 26.4% |
| Immigrants | Eastern Europe | 19.2 /100 | #203 | Poor 26.4% |
Demographics Similar to Lebanese by Wage/Income Gap
In terms of wage/income gap, the demographic groups most similar to Lebanese are Latvian (27.9%, a difference of 0.0%), Immigrants from Japan (27.9%, a difference of 0.030%), Immigrants from England (27.9%, a difference of 0.080%), American (27.8%, a difference of 0.11%), and Bulgarian (27.8%, a difference of 0.15%).
| Demographics | Rating | Rank | Wage/Income Gap |
| Potawatomi | 0.9 /100 | #269 | Tragic 27.7% |
| Immigrants | Western Europe | 0.9 /100 | #270 | Tragic 27.8% |
| Ute | 0.8 /100 | #271 | Tragic 27.8% |
| Immigrants | Korea | 0.8 /100 | #272 | Tragic 27.8% |
| Bulgarians | 0.7 /100 | #273 | Tragic 27.8% |
| Americans | 0.7 /100 | #274 | Tragic 27.8% |
| Immigrants | Japan | 0.7 /100 | #275 | Tragic 27.9% |
| Lebanese | 0.7 /100 | #276 | Tragic 27.9% |
| Latvians | 0.7 /100 | #277 | Tragic 27.9% |
| Immigrants | England | 0.6 /100 | #278 | Tragic 27.9% |
| Romanians | 0.5 /100 | #279 | Tragic 28.0% |
| Russians | 0.5 /100 | #280 | Tragic 28.0% |
| Burmese | 0.5 /100 | #281 | Tragic 28.0% |
| South Africans | 0.5 /100 | #282 | Tragic 28.0% |
| French Canadians | 0.4 /100 | #283 | Tragic 28.1% |