Immigrants from Western Asia vs Immigrants from China Wage/Income Gap
COMPARE
Immigrants from Western Asia
Immigrants from China
Wage/Income Gap
Wage/Income Gap Comparison
Immigrants from Western Asia
Immigrants from China
26.3%
WAGE/INCOME GAP
21.7/ 100
METRIC RATING
196th/ 347
METRIC RANK
26.7%
WAGE/INCOME GAP
10.3/ 100
METRIC RATING
214th/ 347
METRIC RANK
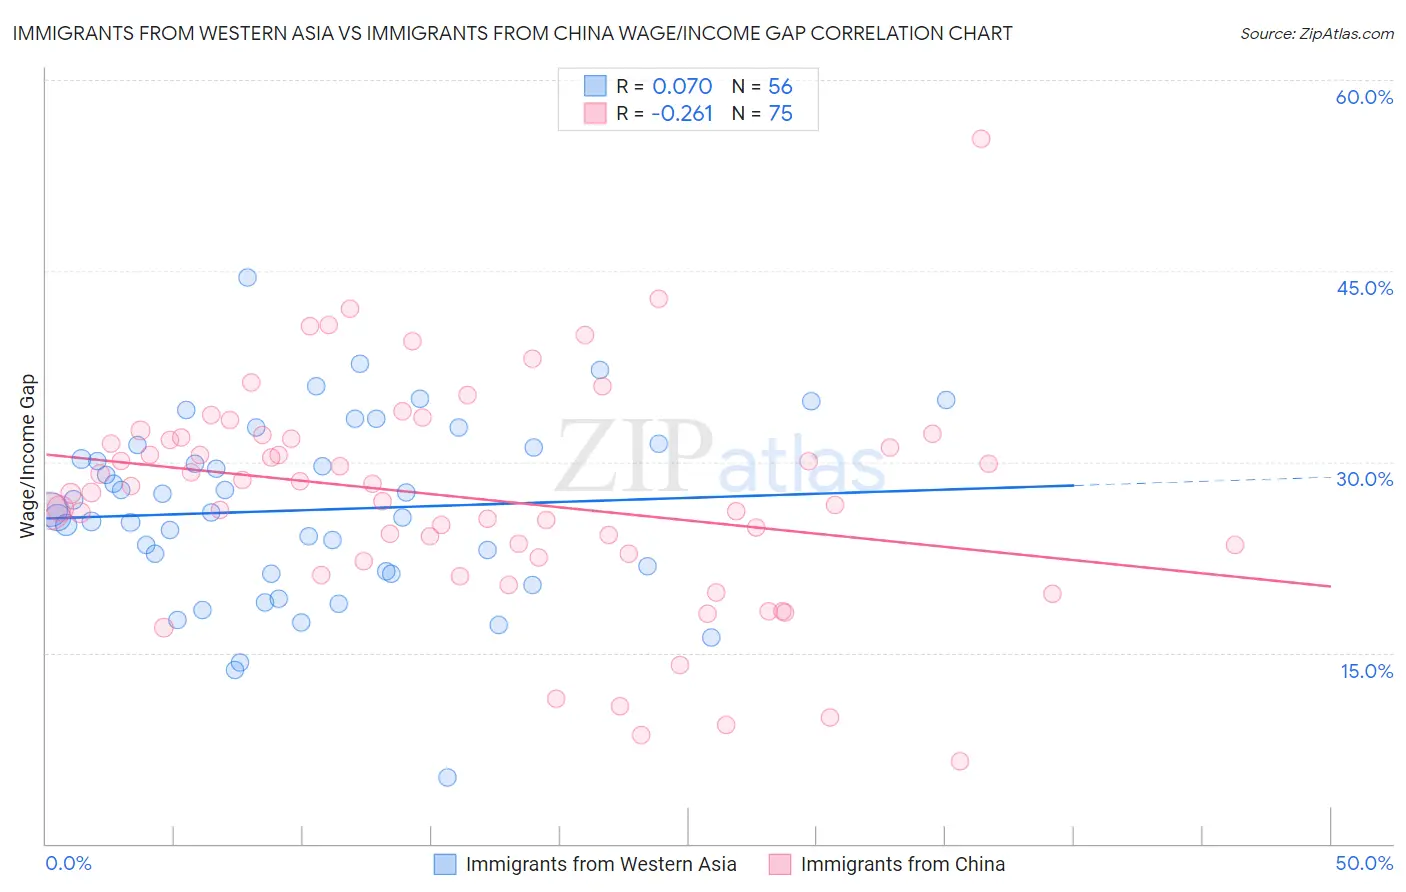
Immigrants from Western Asia vs Immigrants from China Wage/Income Gap Correlation Chart
The statistical analysis conducted on geographies consisting of 404,196,693 people shows a slight positive correlation between the proportion of Immigrants from Western Asia and wage/income gap percentage in the United States with a correlation coefficient (R) of 0.070 and weighted average of 26.3%. Similarly, the statistical analysis conducted on geographies consisting of 456,702,733 people shows a weak negative correlation between the proportion of Immigrants from China and wage/income gap percentage in the United States with a correlation coefficient (R) of -0.261 and weighted average of 26.7%, a difference of 1.4%.
Wage/Income Gap Correlation Summary
| Measurement | Immigrants from Western Asia | Immigrants from China |
| Minimum | 5.2% | 6.5% |
| Maximum | 44.5% | 55.3% |
| Range | 39.3% | 48.9% |
| Mean | 26.2% | 27.2% |
| Median | 26.2% | 27.6% |
| Interquartile 25% (IQ1) | 21.3% | 22.4% |
| Interquartile 75% (IQ3) | 31.2% | 31.9% |
| Interquartile Range (IQR) | 9.9% | 9.5% |
| Standard Deviation (Sample) | 7.1% | 8.7% |
| Standard Deviation (Population) | 7.1% | 8.6% |
Demographics Similar to Immigrants from Western Asia and Immigrants from China by Wage/Income Gap
In terms of wage/income gap, the demographic groups most similar to Immigrants from Western Asia are Zimbabwean (26.3%, a difference of 0.010%), Venezuelan (26.3%, a difference of 0.020%), Immigrants from Malaysia (26.3%, a difference of 0.050%), Dutch West Indian (26.3%, a difference of 0.070%), and Delaware (26.3%, a difference of 0.080%). Similarly, the demographic groups most similar to Immigrants from China are Immigrants from Iraq (26.7%, a difference of 0.010%), Yugoslavian (26.7%, a difference of 0.090%), Iraqi (26.6%, a difference of 0.16%), Mongolian (26.6%, a difference of 0.19%), and Arab (26.6%, a difference of 0.32%).
| Demographics | Rating | Rank | Wage/Income Gap |
| Immigrants | Malaysia | 22.2 /100 | #195 | Fair 26.3% |
| Immigrants | Western Asia | 21.7 /100 | #196 | Fair 26.3% |
| Zimbabweans | 21.6 /100 | #197 | Fair 26.3% |
| Venezuelans | 21.5 /100 | #198 | Fair 26.3% |
| Dutch West Indians | 21.0 /100 | #199 | Fair 26.3% |
| Delaware | 20.9 /100 | #200 | Fair 26.3% |
| Immigrants | Syria | 19.3 /100 | #201 | Poor 26.4% |
| Laotians | 19.2 /100 | #202 | Poor 26.4% |
| Immigrants | Eastern Europe | 19.2 /100 | #203 | Poor 26.4% |
| Immigrants | Russia | 19.0 /100 | #204 | Poor 26.4% |
| Immigrants | Southern Europe | 17.3 /100 | #205 | Poor 26.4% |
| Indians (Asian) | 16.5 /100 | #206 | Poor 26.4% |
| Immigrants | Italy | 15.8 /100 | #207 | Poor 26.5% |
| Egyptians | 12.7 /100 | #208 | Poor 26.6% |
| Immigrants | Kuwait | 12.6 /100 | #209 | Poor 26.6% |
| Arabs | 12.3 /100 | #210 | Poor 26.6% |
| Mongolians | 11.4 /100 | #211 | Poor 26.6% |
| Iraqis | 11.2 /100 | #212 | Poor 26.6% |
| Immigrants | Iraq | 10.3 /100 | #213 | Poor 26.7% |
| Immigrants | China | 10.3 /100 | #214 | Poor 26.7% |
| Yugoslavians | 9.7 /100 | #215 | Tragic 26.7% |