Immigrants from Korea vs Immigrants from Colombia Median Earnings
COMPARE
Immigrants from Korea
Immigrants from Colombia
Median Earnings
Median Earnings Comparison
Immigrants from Korea
Immigrants from Colombia
$54,530
MEDIAN EARNINGS
100.0/ 100
METRIC RATING
22nd/ 347
METRIC RANK
$45,550
MEDIAN EARNINGS
22.4/ 100
METRIC RATING
213th/ 347
METRIC RANK
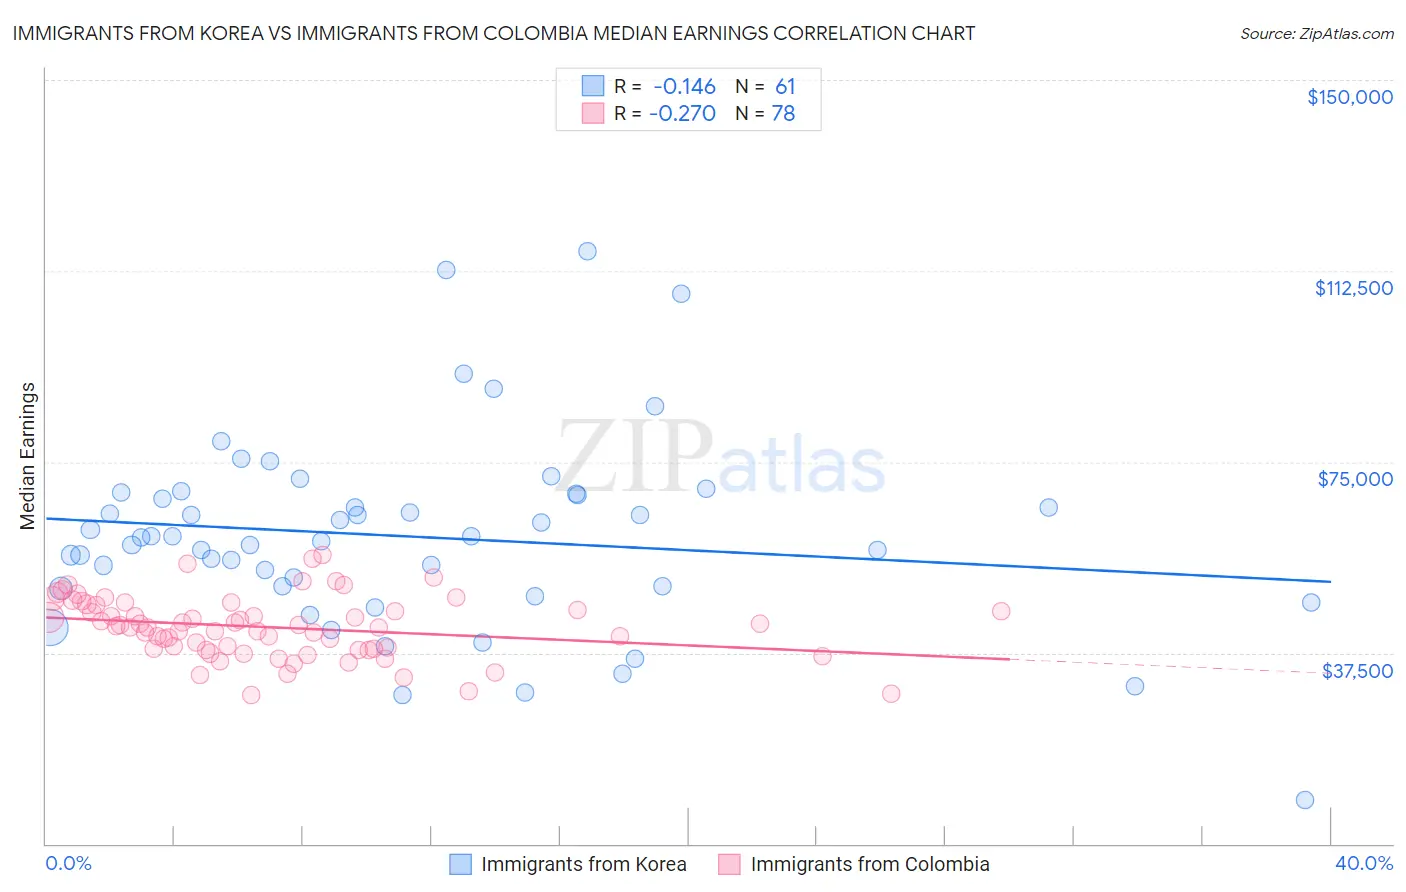
Immigrants from Korea vs Immigrants from Colombia Median Earnings Correlation Chart
The statistical analysis conducted on geographies consisting of 416,330,492 people shows a poor negative correlation between the proportion of Immigrants from Korea and median earnings in the United States with a correlation coefficient (R) of -0.146 and weighted average of $54,530. Similarly, the statistical analysis conducted on geographies consisting of 378,647,626 people shows a weak negative correlation between the proportion of Immigrants from Colombia and median earnings in the United States with a correlation coefficient (R) of -0.270 and weighted average of $45,550, a difference of 19.7%.
Median Earnings Correlation Summary
| Measurement | Immigrants from Korea | Immigrants from Colombia |
| Minimum | $8,707 | $29,284 |
| Maximum | $116,380 | $56,800 |
| Range | $107,673 | $27,517 |
| Mean | $60,321 | $42,514 |
| Median | $60,242 | $42,568 |
| Interquartile 25% (IQ1) | $50,376 | $38,241 |
| Interquartile 75% (IQ3) | $68,586 | $46,823 |
| Interquartile Range (IQR) | $18,211 | $8,582 |
| Standard Deviation (Sample) | $19,123 | $5,984 |
| Standard Deviation (Population) | $18,966 | $5,945 |
Similar Demographics by Median Earnings
Demographics Similar to Immigrants from Korea by Median Earnings
In terms of median earnings, the demographic groups most similar to Immigrants from Korea are Burmese ($54,559, a difference of 0.050%), Immigrants from Sweden ($54,478, a difference of 0.10%), Cypriot ($54,589, a difference of 0.11%), Immigrants from Belgium ($54,679, a difference of 0.27%), and Soviet Union ($54,290, a difference of 0.44%).
| Demographics | Rating | Rank | Median Earnings |
| Indians (Asian) | 100.0 /100 | #15 | Exceptional $56,253 |
| Immigrants | Eastern Asia | 100.0 /100 | #16 | Exceptional $56,183 |
| Eastern Europeans | 100.0 /100 | #17 | Exceptional $55,084 |
| Immigrants | Japan | 100.0 /100 | #18 | Exceptional $54,938 |
| Immigrants | Belgium | 100.0 /100 | #19 | Exceptional $54,679 |
| Cypriots | 100.0 /100 | #20 | Exceptional $54,589 |
| Burmese | 100.0 /100 | #21 | Exceptional $54,559 |
| Immigrants | Korea | 100.0 /100 | #22 | Exceptional $54,530 |
| Immigrants | Sweden | 100.0 /100 | #23 | Exceptional $54,478 |
| Soviet Union | 100.0 /100 | #24 | Exceptional $54,290 |
| Turks | 100.0 /100 | #25 | Exceptional $53,919 |
| Immigrants | Northern Europe | 100.0 /100 | #26 | Exceptional $53,872 |
| Asians | 100.0 /100 | #27 | Exceptional $53,690 |
| Immigrants | France | 100.0 /100 | #28 | Exceptional $53,490 |
| Immigrants | Russia | 100.0 /100 | #29 | Exceptional $53,457 |
Demographics Similar to Immigrants from Colombia by Median Earnings
In terms of median earnings, the demographic groups most similar to Immigrants from Colombia are Nigerian ($45,532, a difference of 0.040%), Immigrants from Bangladesh ($45,532, a difference of 0.040%), Immigrants from Grenada ($45,596, a difference of 0.10%), Panamanian ($45,593, a difference of 0.10%), and Bermudan ($45,593, a difference of 0.10%).
| Demographics | Rating | Rank | Median Earnings |
| Immigrants | Ghana | 24.8 /100 | #206 | Fair $45,641 |
| Immigrants | Senegal | 24.0 /100 | #207 | Fair $45,611 |
| Immigrants | Bosnia and Herzegovina | 23.7 /100 | #208 | Fair $45,600 |
| Immigrants | Thailand | 23.7 /100 | #209 | Fair $45,598 |
| Immigrants | Grenada | 23.6 /100 | #210 | Fair $45,596 |
| Panamanians | 23.5 /100 | #211 | Fair $45,593 |
| Bermudans | 23.5 /100 | #212 | Fair $45,593 |
| Immigrants | Colombia | 22.4 /100 | #213 | Fair $45,550 |
| Nigerians | 22.0 /100 | #214 | Fair $45,532 |
| Immigrants | Bangladesh | 22.0 /100 | #215 | Fair $45,532 |
| Guyanese | 20.6 /100 | #216 | Fair $45,470 |
| Tlingit-Haida | 20.5 /100 | #217 | Fair $45,468 |
| Spanish | 19.7 /100 | #218 | Poor $45,432 |
| Dutch | 18.4 /100 | #219 | Poor $45,370 |
| Ecuadorians | 15.3 /100 | #220 | Poor $45,214 |