Immigrants from Korea vs Immigrants from Colombia In Labor Force | Age 20-64
COMPARE
Immigrants from Korea
Immigrants from Colombia
In Labor Force | Age 20-64
In Labor Force | Age 20-64 Comparison
Immigrants from Korea
Immigrants from Colombia
80.3%
IN LABOR FORCE | AGE 20-64
98.8/ 100
METRIC RATING
63rd/ 347
METRIC RANK
80.2%
IN LABOR FORCE | AGE 20-64
97.8/ 100
METRIC RATING
77th/ 347
METRIC RANK
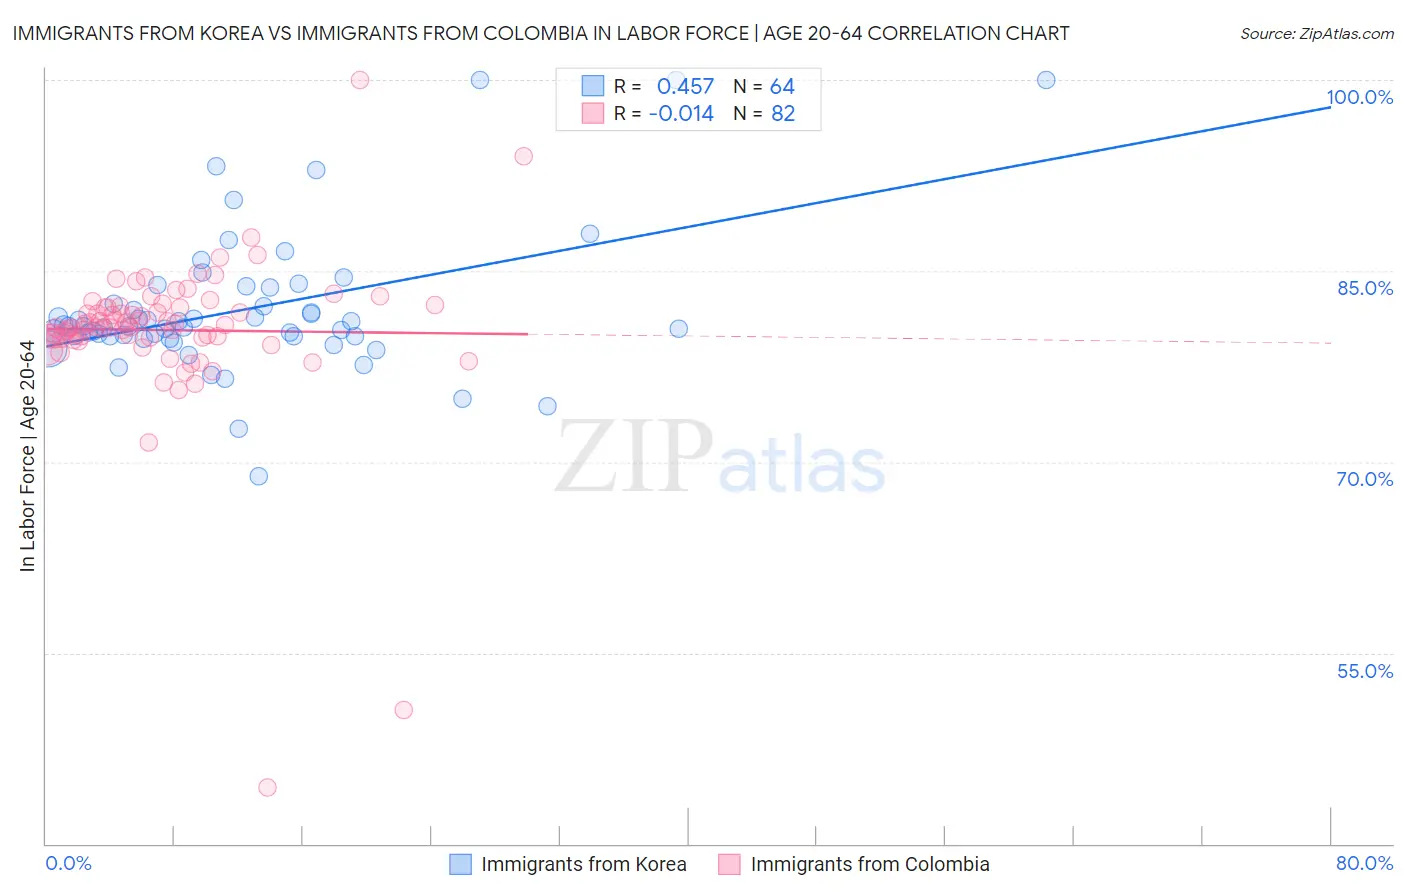
Immigrants from Korea vs Immigrants from Colombia In Labor Force | Age 20-64 Correlation Chart
The statistical analysis conducted on geographies consisting of 416,355,366 people shows a moderate positive correlation between the proportion of Immigrants from Korea and labor force participation rate among population between the ages 20 and 64 in the United States with a correlation coefficient (R) of 0.457 and weighted average of 80.3%. Similarly, the statistical analysis conducted on geographies consisting of 378,682,126 people shows no correlation between the proportion of Immigrants from Colombia and labor force participation rate among population between the ages 20 and 64 in the United States with a correlation coefficient (R) of -0.014 and weighted average of 80.2%, a difference of 0.11%.
In Labor Force | Age 20-64 Correlation Summary
| Measurement | Immigrants from Korea | Immigrants from Colombia |
| Minimum | 68.9% | 44.4% |
| Maximum | 100.0% | 100.0% |
| Range | 31.1% | 55.6% |
| Mean | 82.0% | 80.4% |
| Median | 80.6% | 80.6% |
| Interquartile 25% (IQ1) | 79.9% | 79.7% |
| Interquartile 75% (IQ3) | 83.1% | 82.1% |
| Interquartile Range (IQR) | 3.2% | 2.4% |
| Standard Deviation (Sample) | 5.6% | 6.3% |
| Standard Deviation (Population) | 5.6% | 6.3% |
Demographics Similar to Immigrants from Korea and Immigrants from Colombia by In Labor Force | Age 20-64
In terms of in labor force | age 20-64, the demographic groups most similar to Immigrants from Korea are Immigrants from Albania (80.3%, a difference of 0.0%), Tongan (80.3%, a difference of 0.010%), Burmese (80.3%, a difference of 0.010%), Carpatho Rusyn (80.3%, a difference of 0.010%), and Lithuanian (80.2%, a difference of 0.010%). Similarly, the demographic groups most similar to Immigrants from Colombia are Egyptian (80.2%, a difference of 0.0%), Immigrants from Romania (80.2%, a difference of 0.0%), Immigrants from Afghanistan (80.2%, a difference of 0.010%), Asian (80.2%, a difference of 0.010%), and Immigrants from Croatia (80.1%, a difference of 0.020%).
| Demographics | Rating | Rank | In Labor Force | Age 20-64 |
| Tongans | 98.8 /100 | #60 | Exceptional 80.3% |
| Burmese | 98.8 /100 | #61 | Exceptional 80.3% |
| Carpatho Rusyns | 98.8 /100 | #62 | Exceptional 80.3% |
| Immigrants | Korea | 98.8 /100 | #63 | Exceptional 80.3% |
| Immigrants | Albania | 98.7 /100 | #64 | Exceptional 80.3% |
| Lithuanians | 98.7 /100 | #65 | Exceptional 80.2% |
| Macedonians | 98.7 /100 | #66 | Exceptional 80.2% |
| Taiwanese | 98.6 /100 | #67 | Exceptional 80.2% |
| Bhutanese | 98.6 /100 | #68 | Exceptional 80.2% |
| Albanians | 98.6 /100 | #69 | Exceptional 80.2% |
| Immigrants | Turkey | 98.5 /100 | #70 | Exceptional 80.2% |
| Soviet Union | 98.5 /100 | #71 | Exceptional 80.2% |
| Eastern Europeans | 98.4 /100 | #72 | Exceptional 80.2% |
| Cypriots | 98.2 /100 | #73 | Exceptional 80.2% |
| Immigrants | Eastern Europe | 98.1 /100 | #74 | Exceptional 80.2% |
| Immigrants | Afghanistan | 97.9 /100 | #75 | Exceptional 80.2% |
| Egyptians | 97.8 /100 | #76 | Exceptional 80.2% |
| Immigrants | Colombia | 97.8 /100 | #77 | Exceptional 80.2% |
| Immigrants | Romania | 97.8 /100 | #78 | Exceptional 80.2% |
| Asians | 97.7 /100 | #79 | Exceptional 80.2% |
| Immigrants | Croatia | 97.6 /100 | #80 | Exceptional 80.1% |