Immigrants from Ireland vs Bermudan Wage/Income Gap
COMPARE
Immigrants from Ireland
Bermudan
Wage/Income Gap
Wage/Income Gap Comparison
Immigrants from Ireland
Bermudans
26.9%
WAGE/INCOME GAP
6.5/ 100
METRIC RATING
225th/ 347
METRIC RANK
23.1%
WAGE/INCOME GAP
99.8/ 100
METRIC RATING
81st/ 347
METRIC RANK
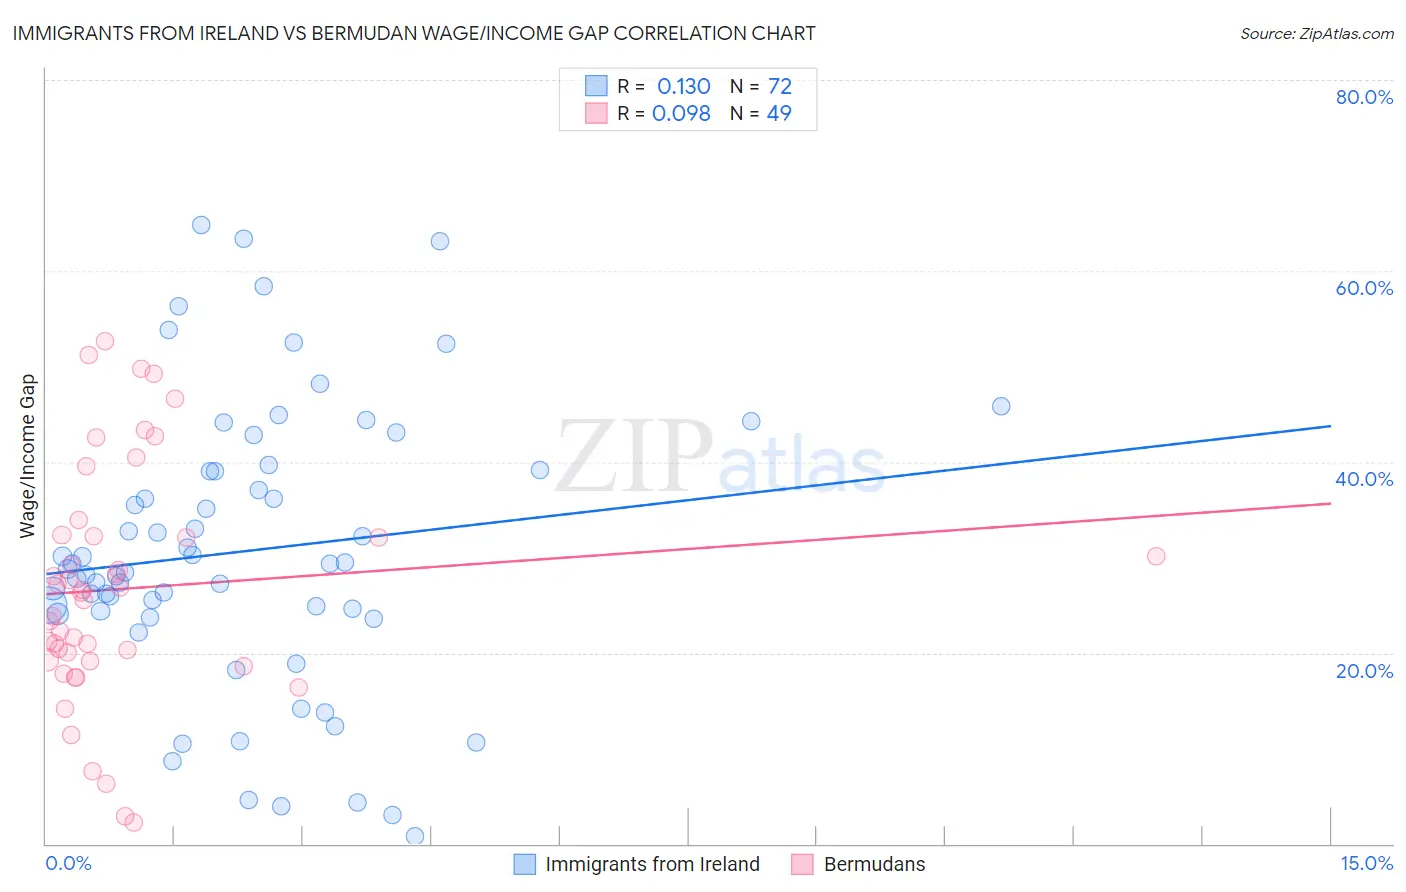
Immigrants from Ireland vs Bermudan Wage/Income Gap Correlation Chart
The statistical analysis conducted on geographies consisting of 240,648,887 people shows a poor positive correlation between the proportion of Immigrants from Ireland and wage/income gap percentage in the United States with a correlation coefficient (R) of 0.130 and weighted average of 26.9%. Similarly, the statistical analysis conducted on geographies consisting of 55,726,543 people shows a slight positive correlation between the proportion of Bermudans and wage/income gap percentage in the United States with a correlation coefficient (R) of 0.098 and weighted average of 23.1%, a difference of 16.4%.
Wage/Income Gap Correlation Summary
| Measurement | Immigrants from Ireland | Bermudan |
| Minimum | 0.77% | 2.2% |
| Maximum | 64.9% | 52.7% |
| Range | 64.1% | 50.5% |
| Mean | 30.6% | 26.7% |
| Median | 29.0% | 26.3% |
| Interquartile 25% (IQ1) | 24.2% | 19.2% |
| Interquartile 75% (IQ3) | 39.1% | 32.3% |
| Interquartile Range (IQR) | 14.9% | 13.1% |
| Standard Deviation (Sample) | 14.7% | 12.3% |
| Standard Deviation (Population) | 14.6% | 12.1% |
Similar Demographics by Wage/Income Gap
Demographics Similar to Immigrants from Ireland by Wage/Income Gap
In terms of wage/income gap, the demographic groups most similar to Immigrants from Ireland are Immigrants from Argentina (26.8%, a difference of 0.17%), Asian (26.9%, a difference of 0.17%), Spaniard (27.0%, a difference of 0.24%), Immigrants from Turkey (27.0%, a difference of 0.25%), and Immigrants from Asia (27.0%, a difference of 0.28%).
| Demographics | Rating | Rank | Wage/Income Gap |
| Immigrants | Saudi Arabia | 9.1 /100 | #218 | Tragic 26.7% |
| Immigrants | Poland | 8.9 /100 | #219 | Tragic 26.7% |
| Immigrants | Latvia | 8.9 /100 | #220 | Tragic 26.7% |
| Immigrants | Spain | 8.5 /100 | #221 | Tragic 26.8% |
| Bolivians | 8.3 /100 | #222 | Tragic 26.8% |
| Jordanians | 8.0 /100 | #223 | Tragic 26.8% |
| Immigrants | Argentina | 7.2 /100 | #224 | Tragic 26.8% |
| Immigrants | Ireland | 6.5 /100 | #225 | Tragic 26.9% |
| Asians | 5.9 /100 | #226 | Tragic 26.9% |
| Spaniards | 5.6 /100 | #227 | Tragic 27.0% |
| Immigrants | Turkey | 5.6 /100 | #228 | Tragic 27.0% |
| Immigrants | Asia | 5.5 /100 | #229 | Tragic 27.0% |
| Ottawa | 5.3 /100 | #230 | Tragic 27.0% |
| Bhutanese | 5.3 /100 | #231 | Tragic 27.0% |
| Argentineans | 5.2 /100 | #232 | Tragic 27.0% |
Demographics Similar to Bermudans by Wage/Income Gap
In terms of wage/income gap, the demographic groups most similar to Bermudans are Central American (23.1%, a difference of 0.0%), Immigrants from Africa (23.2%, a difference of 0.29%), Salvadoran (23.0%, a difference of 0.47%), Immigrants from Nicaragua (23.0%, a difference of 0.54%), and Nigerian (23.0%, a difference of 0.62%).
| Demographics | Rating | Rank | Wage/Income Gap |
| Immigrants | Burma/Myanmar | 99.9 /100 | #74 | Exceptional 22.8% |
| Fijians | 99.9 /100 | #75 | Exceptional 22.9% |
| Ecuadorians | 99.9 /100 | #76 | Exceptional 22.9% |
| Africans | 99.9 /100 | #77 | Exceptional 22.9% |
| Nigerians | 99.9 /100 | #78 | Exceptional 23.0% |
| Immigrants | Nicaragua | 99.9 /100 | #79 | Exceptional 23.0% |
| Salvadorans | 99.9 /100 | #80 | Exceptional 23.0% |
| Bermudans | 99.8 /100 | #81 | Exceptional 23.1% |
| Central Americans | 99.8 /100 | #82 | Exceptional 23.1% |
| Immigrants | Africa | 99.8 /100 | #83 | Exceptional 23.2% |
| Cubans | 99.7 /100 | #84 | Exceptional 23.3% |
| Immigrants | Cambodia | 99.7 /100 | #85 | Exceptional 23.3% |
| Cheyenne | 99.7 /100 | #86 | Exceptional 23.3% |
| Yuman | 99.7 /100 | #87 | Exceptional 23.3% |
| Immigrants | Panama | 99.6 /100 | #88 | Exceptional 23.4% |