Iranian vs Bermudan Wage/Income Gap
COMPARE
Iranian
Bermudan
Wage/Income Gap
Wage/Income Gap Comparison
Iranians
Bermudans
29.7%
WAGE/INCOME GAP
0.0/ 100
METRIC RATING
339th/ 347
METRIC RANK
23.1%
WAGE/INCOME GAP
99.8/ 100
METRIC RATING
81st/ 347
METRIC RANK
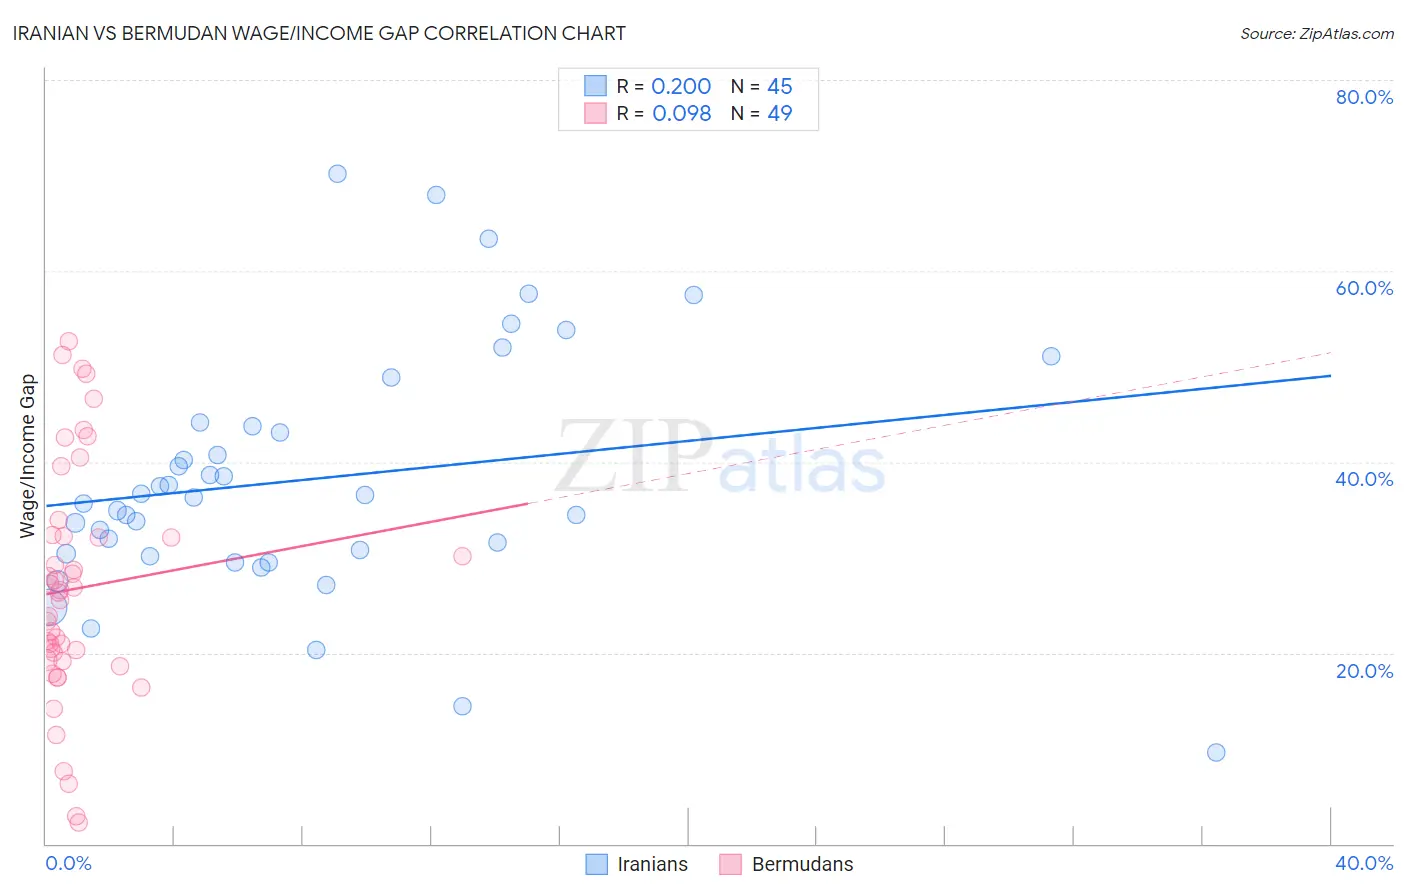
Iranian vs Bermudan Wage/Income Gap Correlation Chart
The statistical analysis conducted on geographies consisting of 316,773,224 people shows a weak positive correlation between the proportion of Iranians and wage/income gap percentage in the United States with a correlation coefficient (R) of 0.200 and weighted average of 29.7%. Similarly, the statistical analysis conducted on geographies consisting of 55,726,543 people shows a slight positive correlation between the proportion of Bermudans and wage/income gap percentage in the United States with a correlation coefficient (R) of 0.098 and weighted average of 23.1%, a difference of 28.6%.
Wage/Income Gap Correlation Summary
| Measurement | Iranian | Bermudan |
| Minimum | 9.6% | 2.2% |
| Maximum | 70.1% | 52.7% |
| Range | 60.5% | 50.5% |
| Mean | 38.2% | 26.7% |
| Median | 36.2% | 26.3% |
| Interquartile 25% (IQ1) | 30.2% | 19.2% |
| Interquartile 75% (IQ3) | 44.0% | 32.3% |
| Interquartile Range (IQR) | 13.8% | 13.1% |
| Standard Deviation (Sample) | 12.9% | 12.3% |
| Standard Deviation (Population) | 12.8% | 12.1% |
Similar Demographics by Wage/Income Gap
Demographics Similar to Iranians by Wage/Income Gap
In terms of wage/income gap, the demographic groups most similar to Iranians are Filipino (29.7%, a difference of 0.060%), Dutch (29.6%, a difference of 0.28%), Swiss (30.0%, a difference of 0.83%), English (29.5%, a difference of 0.86%), and Immigrants from Taiwan (29.5%, a difference of 0.87%).
| Demographics | Rating | Rank | Wage/Income Gap |
| Immigrants | South Central Asia | 0.0 /100 | #332 | Tragic 29.3% |
| Europeans | 0.0 /100 | #333 | Tragic 29.4% |
| Swedes | 0.0 /100 | #334 | Tragic 29.4% |
| Immigrants | Taiwan | 0.0 /100 | #335 | Tragic 29.5% |
| English | 0.0 /100 | #336 | Tragic 29.5% |
| Dutch | 0.0 /100 | #337 | Tragic 29.6% |
| Filipinos | 0.0 /100 | #338 | Tragic 29.7% |
| Iranians | 0.0 /100 | #339 | Tragic 29.7% |
| Swiss | 0.0 /100 | #340 | Tragic 30.0% |
| Thais | 0.0 /100 | #341 | Tragic 30.5% |
| Pennsylvania Germans | 0.0 /100 | #342 | Tragic 30.7% |
| Danes | 0.0 /100 | #343 | Tragic 31.0% |
| Assyrians/Chaldeans/Syriacs | 0.0 /100 | #344 | Tragic 31.0% |
| Immigrants | India | 0.0 /100 | #345 | Tragic 31.5% |
| Cajuns | 0.0 /100 | #346 | Tragic 33.9% |
Demographics Similar to Bermudans by Wage/Income Gap
In terms of wage/income gap, the demographic groups most similar to Bermudans are Central American (23.1%, a difference of 0.0%), Immigrants from Africa (23.2%, a difference of 0.29%), Salvadoran (23.0%, a difference of 0.47%), Immigrants from Nicaragua (23.0%, a difference of 0.54%), and Nigerian (23.0%, a difference of 0.62%).
| Demographics | Rating | Rank | Wage/Income Gap |
| Immigrants | Burma/Myanmar | 99.9 /100 | #74 | Exceptional 22.8% |
| Fijians | 99.9 /100 | #75 | Exceptional 22.9% |
| Ecuadorians | 99.9 /100 | #76 | Exceptional 22.9% |
| Africans | 99.9 /100 | #77 | Exceptional 22.9% |
| Nigerians | 99.9 /100 | #78 | Exceptional 23.0% |
| Immigrants | Nicaragua | 99.9 /100 | #79 | Exceptional 23.0% |
| Salvadorans | 99.9 /100 | #80 | Exceptional 23.0% |
| Bermudans | 99.8 /100 | #81 | Exceptional 23.1% |
| Central Americans | 99.8 /100 | #82 | Exceptional 23.1% |
| Immigrants | Africa | 99.8 /100 | #83 | Exceptional 23.2% |
| Cubans | 99.7 /100 | #84 | Exceptional 23.3% |
| Immigrants | Cambodia | 99.7 /100 | #85 | Exceptional 23.3% |
| Cheyenne | 99.7 /100 | #86 | Exceptional 23.3% |
| Yuman | 99.7 /100 | #87 | Exceptional 23.3% |
| Immigrants | Panama | 99.6 /100 | #88 | Exceptional 23.4% |