Immigrants from Ireland vs Indonesian Wage/Income Gap
COMPARE
Immigrants from Ireland
Indonesian
Wage/Income Gap
Wage/Income Gap Comparison
Immigrants from Ireland
Indonesians
26.9%
WAGE/INCOME GAP
6.5/ 100
METRIC RATING
225th/ 347
METRIC RANK
22.7%
WAGE/INCOME GAP
99.9/ 100
METRIC RATING
69th/ 347
METRIC RANK
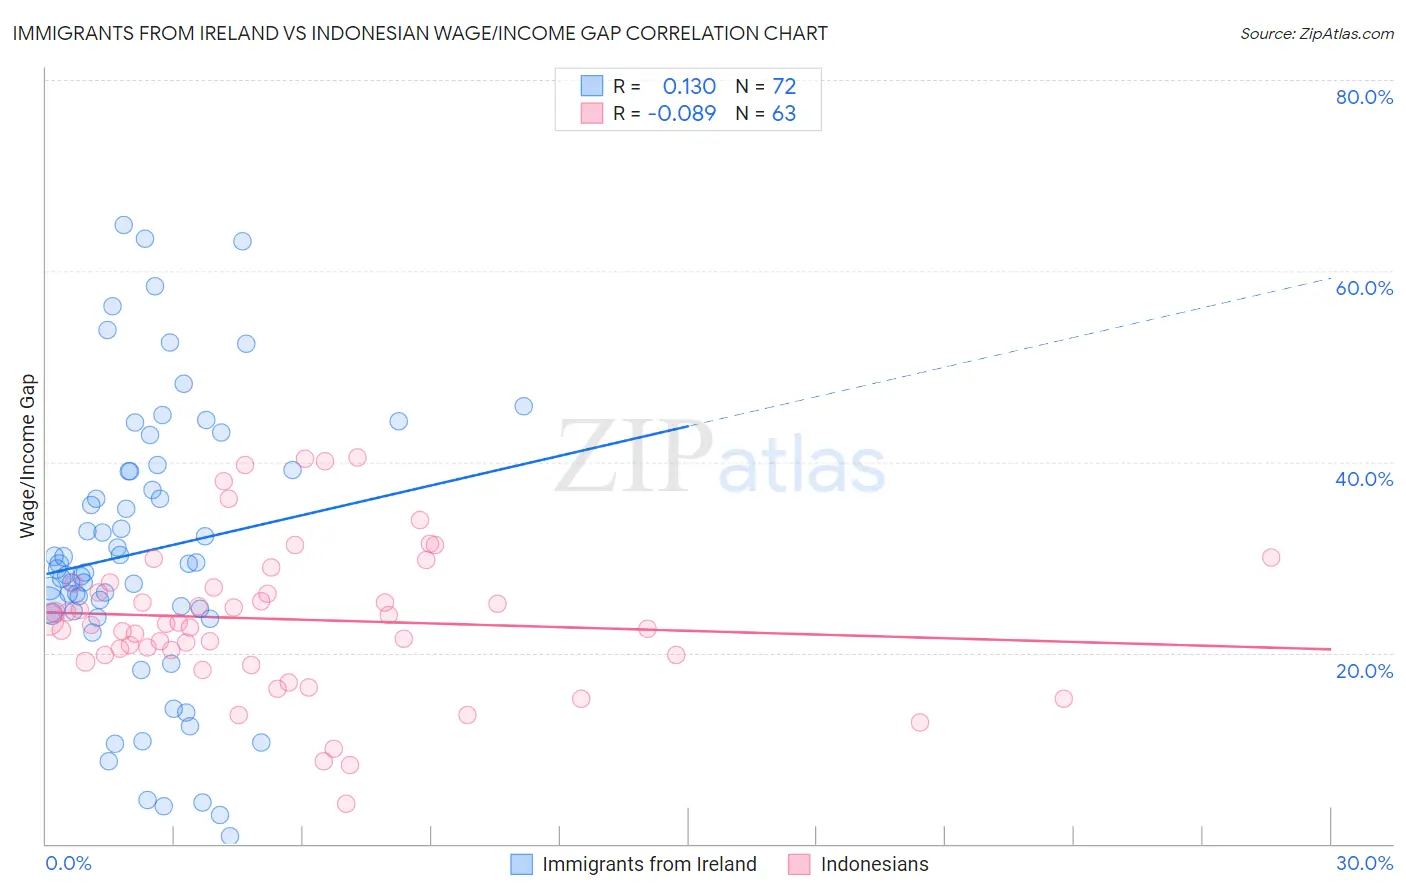
Immigrants from Ireland vs Indonesian Wage/Income Gap Correlation Chart
The statistical analysis conducted on geographies consisting of 240,648,887 people shows a poor positive correlation between the proportion of Immigrants from Ireland and wage/income gap percentage in the United States with a correlation coefficient (R) of 0.130 and weighted average of 26.9%. Similarly, the statistical analysis conducted on geographies consisting of 162,719,006 people shows a slight negative correlation between the proportion of Indonesians and wage/income gap percentage in the United States with a correlation coefficient (R) of -0.089 and weighted average of 22.7%, a difference of 18.3%.
Wage/Income Gap Correlation Summary
| Measurement | Immigrants from Ireland | Indonesian |
| Minimum | 0.77% | 4.2% |
| Maximum | 64.9% | 40.4% |
| Range | 64.1% | 36.2% |
| Mean | 30.6% | 23.5% |
| Median | 29.0% | 23.1% |
| Interquartile 25% (IQ1) | 24.2% | 19.8% |
| Interquartile 75% (IQ3) | 39.1% | 27.3% |
| Interquartile Range (IQR) | 14.9% | 7.5% |
| Standard Deviation (Sample) | 14.7% | 7.8% |
| Standard Deviation (Population) | 14.6% | 7.7% |
Similar Demographics by Wage/Income Gap
Demographics Similar to Immigrants from Ireland by Wage/Income Gap
In terms of wage/income gap, the demographic groups most similar to Immigrants from Ireland are Immigrants from Argentina (26.8%, a difference of 0.17%), Asian (26.9%, a difference of 0.17%), Spaniard (27.0%, a difference of 0.24%), Immigrants from Turkey (27.0%, a difference of 0.25%), and Immigrants from Asia (27.0%, a difference of 0.28%).
| Demographics | Rating | Rank | Wage/Income Gap |
| Immigrants | Saudi Arabia | 9.1 /100 | #218 | Tragic 26.7% |
| Immigrants | Poland | 8.9 /100 | #219 | Tragic 26.7% |
| Immigrants | Latvia | 8.9 /100 | #220 | Tragic 26.7% |
| Immigrants | Spain | 8.5 /100 | #221 | Tragic 26.8% |
| Bolivians | 8.3 /100 | #222 | Tragic 26.8% |
| Jordanians | 8.0 /100 | #223 | Tragic 26.8% |
| Immigrants | Argentina | 7.2 /100 | #224 | Tragic 26.8% |
| Immigrants | Ireland | 6.5 /100 | #225 | Tragic 26.9% |
| Asians | 5.9 /100 | #226 | Tragic 26.9% |
| Spaniards | 5.6 /100 | #227 | Tragic 27.0% |
| Immigrants | Turkey | 5.6 /100 | #228 | Tragic 27.0% |
| Immigrants | Asia | 5.5 /100 | #229 | Tragic 27.0% |
| Ottawa | 5.3 /100 | #230 | Tragic 27.0% |
| Bhutanese | 5.3 /100 | #231 | Tragic 27.0% |
| Argentineans | 5.2 /100 | #232 | Tragic 27.0% |
Demographics Similar to Indonesians by Wage/Income Gap
In terms of wage/income gap, the demographic groups most similar to Indonesians are Immigrants from Nigeria (22.7%, a difference of 0.030%), Menominee (22.7%, a difference of 0.040%), Immigrants from Uzbekistan (22.7%, a difference of 0.11%), Central American Indian (22.7%, a difference of 0.21%), and Immigrants from El Salvador (22.8%, a difference of 0.28%).
| Demographics | Rating | Rank | Wage/Income Gap |
| Immigrants | Guatemala | 100.0 /100 | #62 | Exceptional 22.5% |
| Immigrants | Ecuador | 100.0 /100 | #63 | Exceptional 22.5% |
| Spanish American Indians | 100.0 /100 | #64 | Exceptional 22.5% |
| Guatemalans | 99.9 /100 | #65 | Exceptional 22.6% |
| Central American Indians | 99.9 /100 | #66 | Exceptional 22.7% |
| Menominee | 99.9 /100 | #67 | Exceptional 22.7% |
| Immigrants | Nigeria | 99.9 /100 | #68 | Exceptional 22.7% |
| Indonesians | 99.9 /100 | #69 | Exceptional 22.7% |
| Immigrants | Uzbekistan | 99.9 /100 | #70 | Exceptional 22.7% |
| Immigrants | El Salvador | 99.9 /100 | #71 | Exceptional 22.8% |
| Sub-Saharan Africans | 99.9 /100 | #72 | Exceptional 22.8% |
| Immigrants | Eastern Africa | 99.9 /100 | #73 | Exceptional 22.8% |
| Immigrants | Burma/Myanmar | 99.9 /100 | #74 | Exceptional 22.8% |
| Fijians | 99.9 /100 | #75 | Exceptional 22.9% |
| Ecuadorians | 99.9 /100 | #76 | Exceptional 22.9% |