Immigrants from Ireland vs Bermudan 3 or more Vehicles in Household
COMPARE
Immigrants from Ireland
Bermudan
3 or more Vehicles in Household
3 or more Vehicles in Household Comparison
Immigrants from Ireland
Bermudans
17.3%
3 OR MORE VEHICLES IN HOUSEHOLD
0.3/ 100
METRIC RATING
282nd/ 347
METRIC RANK
17.8%
3 OR MORE VEHICLES IN HOUSEHOLD
0.9/ 100
METRIC RATING
263rd/ 347
METRIC RANK
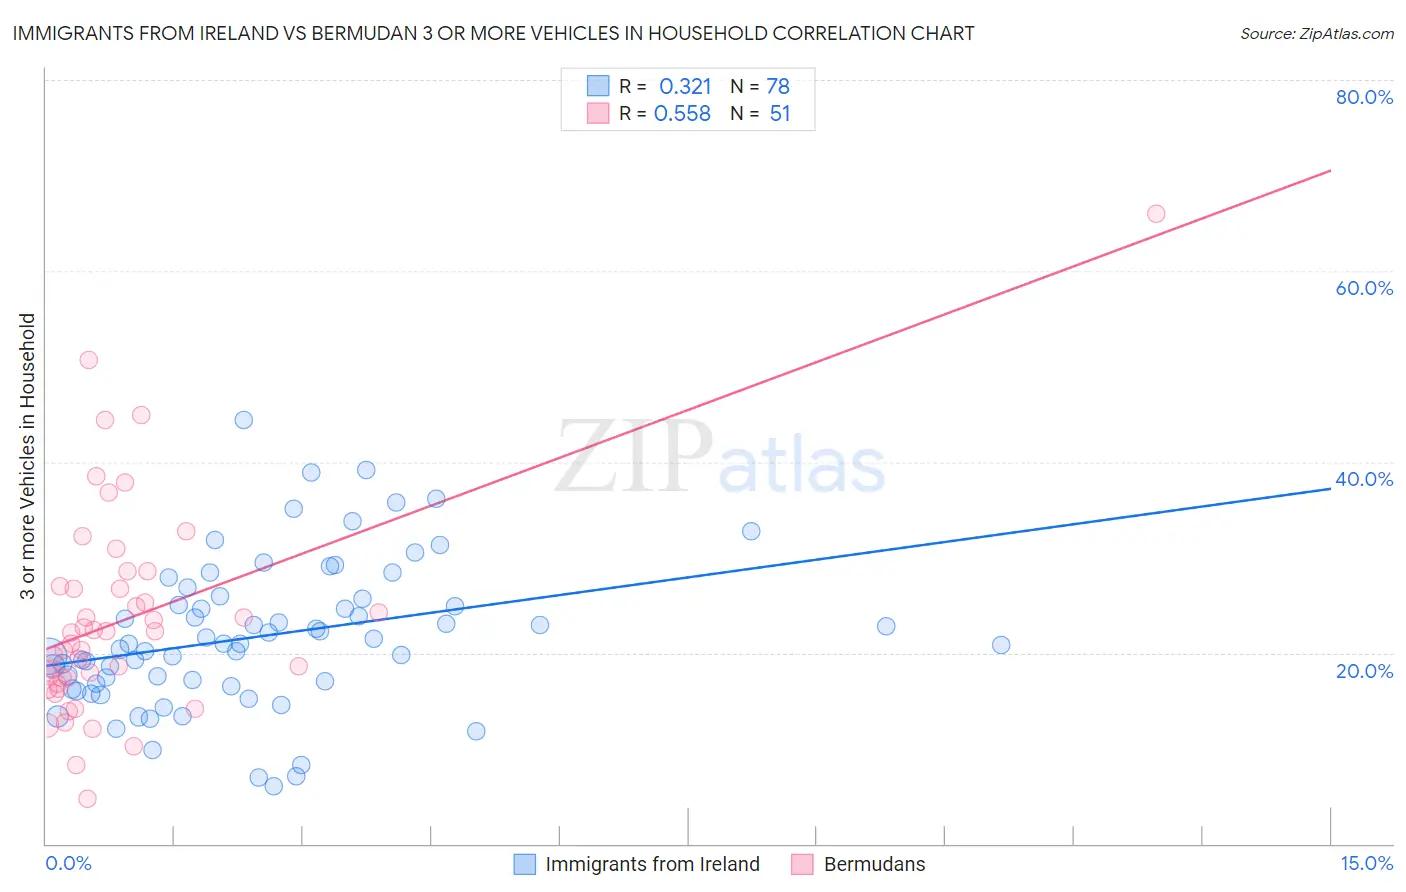
Immigrants from Ireland vs Bermudan 3 or more Vehicles in Household Correlation Chart
The statistical analysis conducted on geographies consisting of 240,727,635 people shows a mild positive correlation between the proportion of Immigrants from Ireland and percentage of households with 3 or more vehicles available in the United States with a correlation coefficient (R) of 0.321 and weighted average of 17.3%. Similarly, the statistical analysis conducted on geographies consisting of 55,710,520 people shows a substantial positive correlation between the proportion of Bermudans and percentage of households with 3 or more vehicles available in the United States with a correlation coefficient (R) of 0.558 and weighted average of 17.8%, a difference of 2.4%.
3 or more Vehicles in Household Correlation Summary
| Measurement | Immigrants from Ireland | Bermudan |
| Minimum | 6.0% | 4.8% |
| Maximum | 44.3% | 66.0% |
| Range | 38.3% | 61.2% |
| Mean | 21.7% | 23.6% |
| Median | 20.9% | 22.1% |
| Interquartile 25% (IQ1) | 16.8% | 16.7% |
| Interquartile 75% (IQ3) | 25.6% | 27.0% |
| Interquartile Range (IQR) | 8.8% | 10.3% |
| Standard Deviation (Sample) | 7.8% | 11.2% |
| Standard Deviation (Population) | 7.7% | 11.1% |
Demographics Similar to Immigrants from Ireland and Bermudans by 3 or more Vehicles in Household
In terms of 3 or more vehicles in household, the demographic groups most similar to Immigrants from Ireland are Immigrants from Latvia (17.4%, a difference of 0.29%), Immigrants from Eastern Europe (17.4%, a difference of 0.33%), Immigrants from Kazakhstan (17.4%, a difference of 0.37%), Immigrants from Bahamas (17.4%, a difference of 0.39%), and Brazilian (17.4%, a difference of 0.48%). Similarly, the demographic groups most similar to Bermudans are Cambodian (17.8%, a difference of 0.030%), Colombian (17.8%, a difference of 0.11%), Immigrants from Panama (17.7%, a difference of 0.16%), Macedonian (17.7%, a difference of 0.19%), and Immigrants from Venezuela (17.7%, a difference of 0.24%).
| Demographics | Rating | Rank | 3 or more Vehicles in Household |
| Colombians | 0.9 /100 | #262 | Tragic 17.8% |
| Bermudans | 0.9 /100 | #263 | Tragic 17.8% |
| Cambodians | 0.9 /100 | #264 | Tragic 17.8% |
| Immigrants | Panama | 0.8 /100 | #265 | Tragic 17.7% |
| Macedonians | 0.8 /100 | #266 | Tragic 17.7% |
| Immigrants | Venezuela | 0.8 /100 | #267 | Tragic 17.7% |
| Immigrants | Bulgaria | 0.8 /100 | #268 | Tragic 17.7% |
| Immigrants | France | 0.6 /100 | #269 | Tragic 17.6% |
| Immigrants | Nepal | 0.6 /100 | #270 | Tragic 17.6% |
| South Americans | 0.6 /100 | #271 | Tragic 17.6% |
| Immigrants | Africa | 0.5 /100 | #272 | Tragic 17.6% |
| Immigrants | Sudan | 0.5 /100 | #273 | Tragic 17.6% |
| Immigrants | Bosnia and Herzegovina | 0.5 /100 | #274 | Tragic 17.5% |
| Immigrants | Ukraine | 0.4 /100 | #275 | Tragic 17.5% |
| Okinawans | 0.4 /100 | #276 | Tragic 17.4% |
| Brazilians | 0.4 /100 | #277 | Tragic 17.4% |
| Immigrants | Bahamas | 0.3 /100 | #278 | Tragic 17.4% |
| Immigrants | Kazakhstan | 0.3 /100 | #279 | Tragic 17.4% |
| Immigrants | Eastern Europe | 0.3 /100 | #280 | Tragic 17.4% |
| Immigrants | Latvia | 0.3 /100 | #281 | Tragic 17.4% |
| Immigrants | Ireland | 0.3 /100 | #282 | Tragic 17.3% |