Immigrants from Ireland vs Pennsylvania German Wage/Income Gap
COMPARE
Immigrants from Ireland
Pennsylvania German
Wage/Income Gap
Wage/Income Gap Comparison
Immigrants from Ireland
Pennsylvania Germans
26.9%
WAGE/INCOME GAP
6.5/ 100
METRIC RATING
225th/ 347
METRIC RANK
30.7%
WAGE/INCOME GAP
0.0/ 100
METRIC RATING
342nd/ 347
METRIC RANK
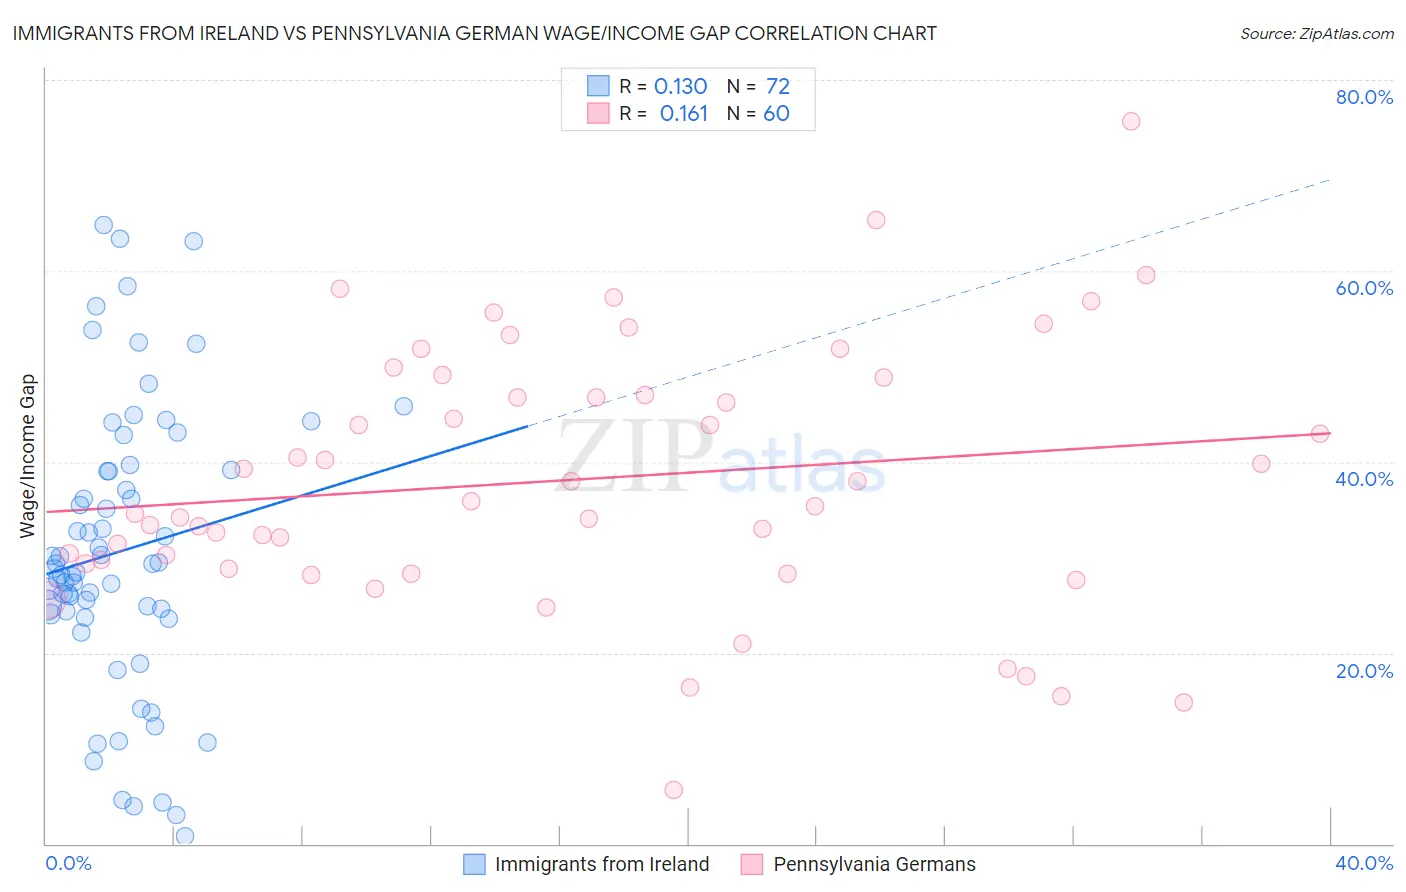
Immigrants from Ireland vs Pennsylvania German Wage/Income Gap Correlation Chart
The statistical analysis conducted on geographies consisting of 240,648,887 people shows a poor positive correlation between the proportion of Immigrants from Ireland and wage/income gap percentage in the United States with a correlation coefficient (R) of 0.130 and weighted average of 26.9%. Similarly, the statistical analysis conducted on geographies consisting of 233,865,703 people shows a poor positive correlation between the proportion of Pennsylvania Germans and wage/income gap percentage in the United States with a correlation coefficient (R) of 0.161 and weighted average of 30.7%, a difference of 14.2%.
Wage/Income Gap Correlation Summary
| Measurement | Immigrants from Ireland | Pennsylvania German |
| Minimum | 0.77% | 5.6% |
| Maximum | 64.9% | 75.6% |
| Range | 64.1% | 70.1% |
| Mean | 30.6% | 38.1% |
| Median | 29.0% | 35.6% |
| Interquartile 25% (IQ1) | 24.2% | 29.1% |
| Interquartile 75% (IQ3) | 39.1% | 48.0% |
| Interquartile Range (IQR) | 14.9% | 18.9% |
| Standard Deviation (Sample) | 14.7% | 13.8% |
| Standard Deviation (Population) | 14.6% | 13.6% |
Similar Demographics by Wage/Income Gap
Demographics Similar to Immigrants from Ireland by Wage/Income Gap
In terms of wage/income gap, the demographic groups most similar to Immigrants from Ireland are Immigrants from Argentina (26.8%, a difference of 0.17%), Asian (26.9%, a difference of 0.17%), Spaniard (27.0%, a difference of 0.24%), Immigrants from Turkey (27.0%, a difference of 0.25%), and Immigrants from Asia (27.0%, a difference of 0.28%).
| Demographics | Rating | Rank | Wage/Income Gap |
| Immigrants | Saudi Arabia | 9.1 /100 | #218 | Tragic 26.7% |
| Immigrants | Poland | 8.9 /100 | #219 | Tragic 26.7% |
| Immigrants | Latvia | 8.9 /100 | #220 | Tragic 26.7% |
| Immigrants | Spain | 8.5 /100 | #221 | Tragic 26.8% |
| Bolivians | 8.3 /100 | #222 | Tragic 26.8% |
| Jordanians | 8.0 /100 | #223 | Tragic 26.8% |
| Immigrants | Argentina | 7.2 /100 | #224 | Tragic 26.8% |
| Immigrants | Ireland | 6.5 /100 | #225 | Tragic 26.9% |
| Asians | 5.9 /100 | #226 | Tragic 26.9% |
| Spaniards | 5.6 /100 | #227 | Tragic 27.0% |
| Immigrants | Turkey | 5.6 /100 | #228 | Tragic 27.0% |
| Immigrants | Asia | 5.5 /100 | #229 | Tragic 27.0% |
| Ottawa | 5.3 /100 | #230 | Tragic 27.0% |
| Bhutanese | 5.3 /100 | #231 | Tragic 27.0% |
| Argentineans | 5.2 /100 | #232 | Tragic 27.0% |
Demographics Similar to Pennsylvania Germans by Wage/Income Gap
In terms of wage/income gap, the demographic groups most similar to Pennsylvania Germans are Thai (30.5%, a difference of 0.77%), Danish (31.0%, a difference of 0.84%), Assyrian/Chaldean/Syriac (31.0%, a difference of 0.97%), Swiss (30.0%, a difference of 2.5%), and Immigrants from India (31.5%, a difference of 2.7%).
| Demographics | Rating | Rank | Wage/Income Gap |
| Europeans | 0.0 /100 | #333 | Tragic 29.4% |
| Swedes | 0.0 /100 | #334 | Tragic 29.4% |
| Immigrants | Taiwan | 0.0 /100 | #335 | Tragic 29.5% |
| English | 0.0 /100 | #336 | Tragic 29.5% |
| Dutch | 0.0 /100 | #337 | Tragic 29.6% |
| Filipinos | 0.0 /100 | #338 | Tragic 29.7% |
| Iranians | 0.0 /100 | #339 | Tragic 29.7% |
| Swiss | 0.0 /100 | #340 | Tragic 30.0% |
| Thais | 0.0 /100 | #341 | Tragic 30.5% |
| Pennsylvania Germans | 0.0 /100 | #342 | Tragic 30.7% |
| Danes | 0.0 /100 | #343 | Tragic 31.0% |
| Assyrians/Chaldeans/Syriacs | 0.0 /100 | #344 | Tragic 31.0% |
| Immigrants | India | 0.0 /100 | #345 | Tragic 31.5% |
| Cajuns | 0.0 /100 | #346 | Tragic 33.9% |
| Houma | 0.0 /100 | #347 | Tragic 38.7% |