Immigrants from Burma/Myanmar vs Indian (Asian) Median Female Earnings
COMPARE
Immigrants from Burma/Myanmar
Indian (Asian)
Median Female Earnings
Median Female Earnings Comparison
Immigrants from Burma/Myanmar
Indians (Asian)
$38,028
MEDIAN FEMALE EARNINGS
3.0/ 100
METRIC RATING
242nd/ 347
METRIC RANK
$46,481
MEDIAN FEMALE EARNINGS
100.0/ 100
METRIC RATING
16th/ 347
METRIC RANK
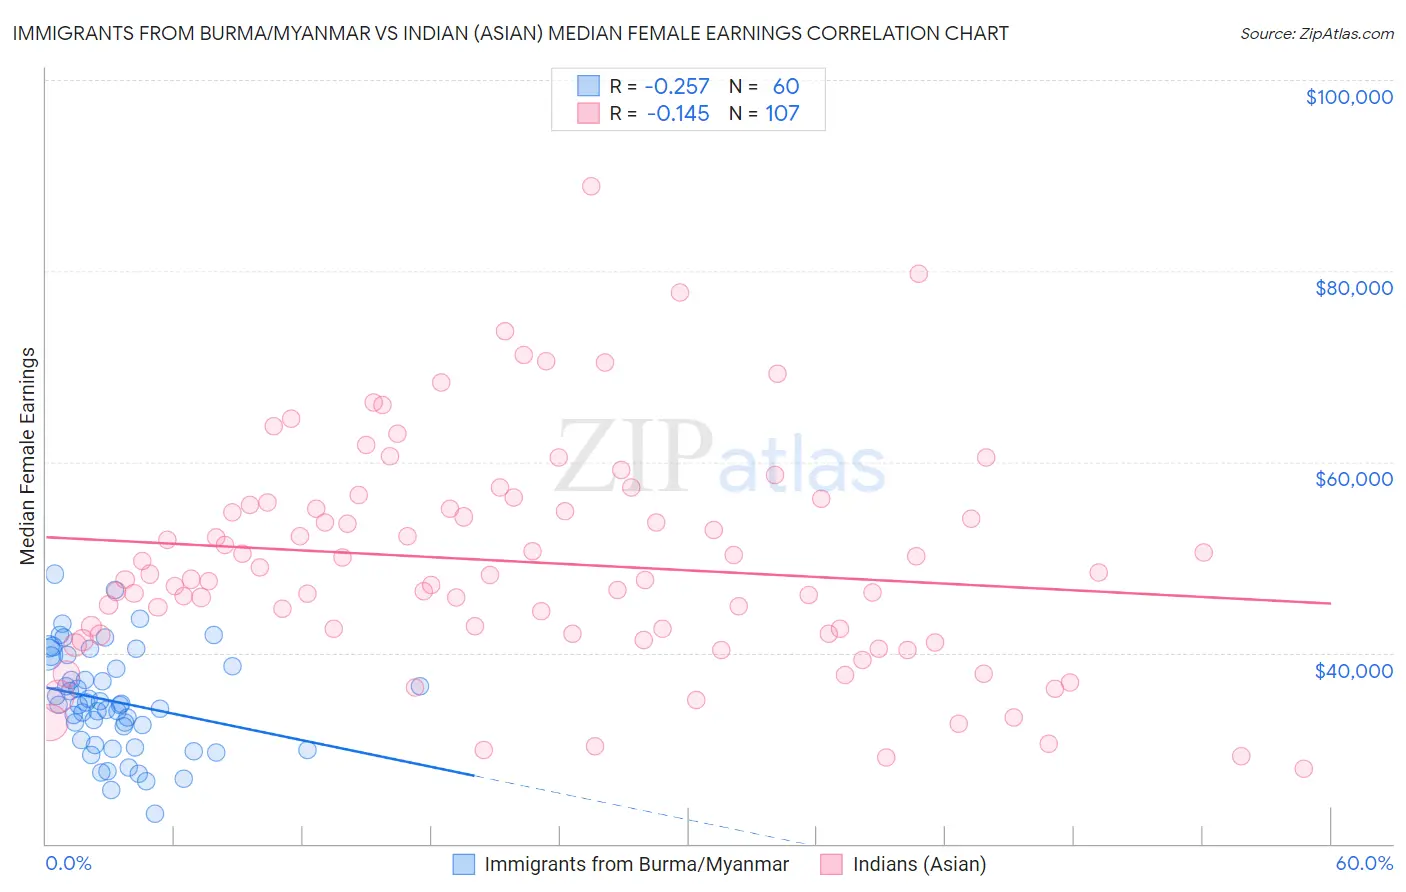
Immigrants from Burma/Myanmar vs Indian (Asian) Median Female Earnings Correlation Chart
The statistical analysis conducted on geographies consisting of 172,347,432 people shows a weak negative correlation between the proportion of Immigrants from Burma/Myanmar and median female earnings in the United States with a correlation coefficient (R) of -0.257 and weighted average of $38,028. Similarly, the statistical analysis conducted on geographies consisting of 494,787,725 people shows a poor negative correlation between the proportion of Indians (Asian) and median female earnings in the United States with a correlation coefficient (R) of -0.145 and weighted average of $46,481, a difference of 22.2%.
Median Female Earnings Correlation Summary
| Measurement | Immigrants from Burma/Myanmar | Indian (Asian) |
| Minimum | $23,125 | $27,791 |
| Maximum | $48,239 | $88,889 |
| Range | $25,114 | $61,098 |
| Mean | $34,892 | $49,511 |
| Median | $34,545 | $47,694 |
| Interquartile 25% (IQ1) | $30,606 | $42,024 |
| Interquartile 75% (IQ3) | $39,132 | $55,457 |
| Interquartile Range (IQR) | $8,525 | $13,433 |
| Standard Deviation (Sample) | $5,366 | $11,605 |
| Standard Deviation (Population) | $5,321 | $11,550 |
Similar Demographics by Median Female Earnings
Demographics Similar to Immigrants from Burma/Myanmar by Median Female Earnings
In terms of median female earnings, the demographic groups most similar to Immigrants from Burma/Myanmar are German ($37,986, a difference of 0.11%), Immigrants from Liberia ($37,970, a difference of 0.15%), Immigrants from Middle Africa ($37,965, a difference of 0.17%), Delaware ($37,964, a difference of 0.17%), and Spanish ($38,098, a difference of 0.18%).
| Demographics | Rating | Rank | Median Female Earnings |
| Sudanese | 4.4 /100 | #235 | Tragic $38,215 |
| Liberians | 4.4 /100 | #236 | Tragic $38,215 |
| Immigrants | Cabo Verde | 4.3 /100 | #237 | Tragic $38,208 |
| Alaska Natives | 4.3 /100 | #238 | Tragic $38,202 |
| English | 4.2 /100 | #239 | Tragic $38,196 |
| Finns | 4.0 /100 | #240 | Tragic $38,173 |
| Spanish | 3.5 /100 | #241 | Tragic $38,098 |
| Immigrants | Burma/Myanmar | 3.0 /100 | #242 | Tragic $38,028 |
| Germans | 2.8 /100 | #243 | Tragic $37,986 |
| Immigrants | Liberia | 2.7 /100 | #244 | Tragic $37,970 |
| Immigrants | Middle Africa | 2.7 /100 | #245 | Tragic $37,965 |
| Delaware | 2.6 /100 | #246 | Tragic $37,964 |
| Immigrants | Somalia | 2.4 /100 | #247 | Tragic $37,914 |
| Alaskan Athabascans | 2.3 /100 | #248 | Tragic $37,905 |
| Swiss | 2.3 /100 | #249 | Tragic $37,904 |
Demographics Similar to Indians (Asian) by Median Female Earnings
In terms of median female earnings, the demographic groups most similar to Indians (Asian) are Immigrants from Eastern Asia ($46,502, a difference of 0.050%), Soviet Union ($46,556, a difference of 0.16%), Immigrants from Australia ($46,573, a difference of 0.20%), Immigrants from South Central Asia ($46,324, a difference of 0.34%), and Okinawan ($46,905, a difference of 0.91%).
| Demographics | Rating | Rank | Median Female Earnings |
| Immigrants | Iran | 100.0 /100 | #9 | Exceptional $47,154 |
| Immigrants | China | 100.0 /100 | #10 | Exceptional $46,972 |
| Okinawans | 100.0 /100 | #11 | Exceptional $46,905 |
| Immigrants | Israel | 100.0 /100 | #12 | Exceptional $46,902 |
| Immigrants | Australia | 100.0 /100 | #13 | Exceptional $46,573 |
| Soviet Union | 100.0 /100 | #14 | Exceptional $46,556 |
| Immigrants | Eastern Asia | 100.0 /100 | #15 | Exceptional $46,502 |
| Indians (Asian) | 100.0 /100 | #16 | Exceptional $46,481 |
| Immigrants | South Central Asia | 100.0 /100 | #17 | Exceptional $46,324 |
| Cypriots | 100.0 /100 | #18 | Exceptional $45,570 |
| Eastern Europeans | 100.0 /100 | #19 | Exceptional $45,385 |
| Immigrants | Japan | 100.0 /100 | #20 | Exceptional $45,323 |
| Cambodians | 100.0 /100 | #21 | Exceptional $45,014 |
| Immigrants | Greece | 100.0 /100 | #22 | Exceptional $44,976 |
| Burmese | 100.0 /100 | #23 | Exceptional $44,911 |