Immigrants from Burma/Myanmar vs Dutch Median Female Earnings
COMPARE
Immigrants from Burma/Myanmar
Dutch
Median Female Earnings
Median Female Earnings Comparison
Immigrants from Burma/Myanmar
Dutch
$38,028
MEDIAN FEMALE EARNINGS
3.0/ 100
METRIC RATING
242nd/ 347
METRIC RANK
$37,339
MEDIAN FEMALE EARNINGS
0.7/ 100
METRIC RATING
260th/ 347
METRIC RANK
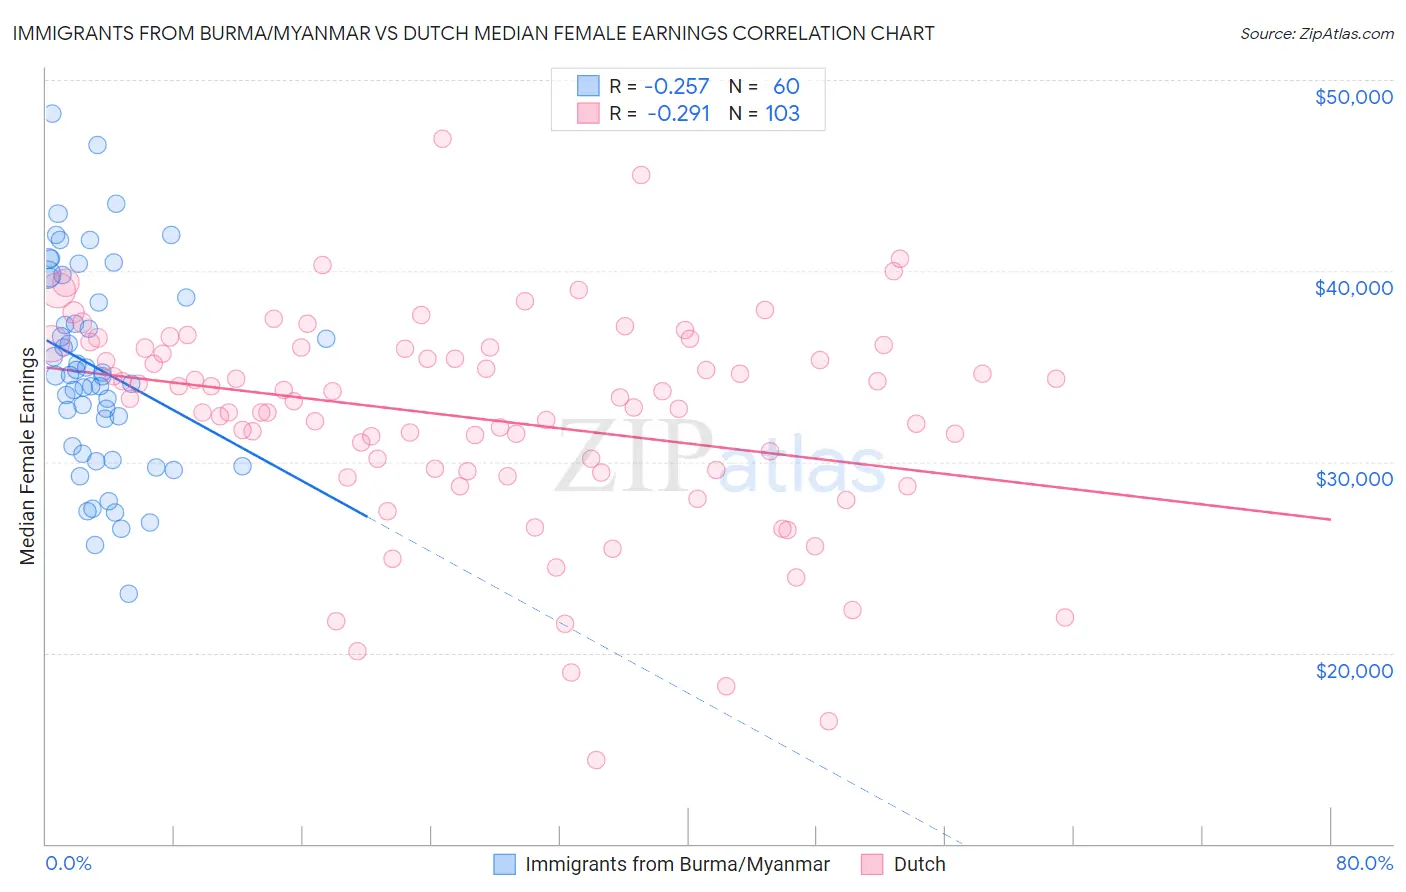
Immigrants from Burma/Myanmar vs Dutch Median Female Earnings Correlation Chart
The statistical analysis conducted on geographies consisting of 172,347,432 people shows a weak negative correlation between the proportion of Immigrants from Burma/Myanmar and median female earnings in the United States with a correlation coefficient (R) of -0.257 and weighted average of $38,028. Similarly, the statistical analysis conducted on geographies consisting of 553,021,757 people shows a weak negative correlation between the proportion of Dutch and median female earnings in the United States with a correlation coefficient (R) of -0.291 and weighted average of $37,339, a difference of 1.8%.
Median Female Earnings Correlation Summary
| Measurement | Immigrants from Burma/Myanmar | Dutch |
| Minimum | $23,125 | $14,375 |
| Maximum | $48,239 | $46,907 |
| Range | $25,114 | $32,532 |
| Mean | $34,892 | $32,260 |
| Median | $34,545 | $33,299 |
| Interquartile 25% (IQ1) | $30,606 | $29,508 |
| Interquartile 75% (IQ3) | $39,132 | $35,979 |
| Interquartile Range (IQR) | $8,525 | $6,471 |
| Standard Deviation (Sample) | $5,366 | $5,704 |
| Standard Deviation (Population) | $5,321 | $5,676 |
Demographics Similar to Immigrants from Burma/Myanmar and Dutch by Median Female Earnings
In terms of median female earnings, the demographic groups most similar to Immigrants from Burma/Myanmar are German ($37,986, a difference of 0.11%), Immigrants from Liberia ($37,970, a difference of 0.15%), Immigrants from Middle Africa ($37,965, a difference of 0.17%), Delaware ($37,964, a difference of 0.17%), and Spanish ($38,098, a difference of 0.18%). Similarly, the demographic groups most similar to Dutch are Malaysian ($37,298, a difference of 0.11%), Scotch-Irish ($37,383, a difference of 0.12%), Belizean ($37,429, a difference of 0.24%), Hawaiian ($37,497, a difference of 0.42%), and Samoan ($37,498, a difference of 0.43%).
| Demographics | Rating | Rank | Median Female Earnings |
| Spanish | 3.5 /100 | #241 | Tragic $38,098 |
| Immigrants | Burma/Myanmar | 3.0 /100 | #242 | Tragic $38,028 |
| Germans | 2.8 /100 | #243 | Tragic $37,986 |
| Immigrants | Liberia | 2.7 /100 | #244 | Tragic $37,970 |
| Immigrants | Middle Africa | 2.7 /100 | #245 | Tragic $37,965 |
| Delaware | 2.6 /100 | #246 | Tragic $37,964 |
| Immigrants | Somalia | 2.4 /100 | #247 | Tragic $37,914 |
| Alaskan Athabascans | 2.3 /100 | #248 | Tragic $37,905 |
| Swiss | 2.3 /100 | #249 | Tragic $37,904 |
| Immigrants | Iraq | 2.2 /100 | #250 | Tragic $37,864 |
| Welsh | 2.1 /100 | #251 | Tragic $37,856 |
| Immigrants | Dominica | 2.0 /100 | #252 | Tragic $37,825 |
| Danes | 1.6 /100 | #253 | Tragic $37,730 |
| Whites/Caucasians | 1.1 /100 | #254 | Tragic $37,531 |
| Colville | 1.1 /100 | #255 | Tragic $37,514 |
| Samoans | 1.0 /100 | #256 | Tragic $37,498 |
| Hawaiians | 1.0 /100 | #257 | Tragic $37,497 |
| Belizeans | 0.9 /100 | #258 | Tragic $37,429 |
| Scotch-Irish | 0.8 /100 | #259 | Tragic $37,383 |
| Dutch | 0.7 /100 | #260 | Tragic $37,339 |
| Malaysians | 0.7 /100 | #261 | Tragic $37,298 |